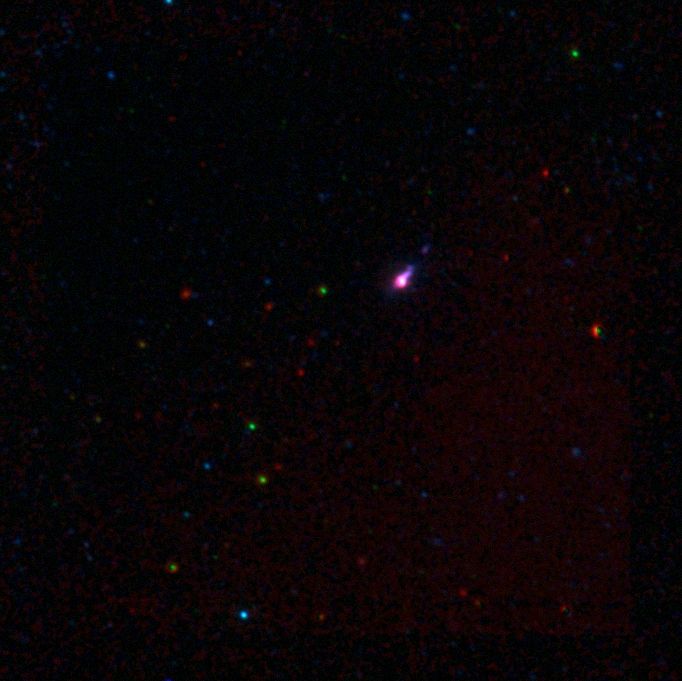
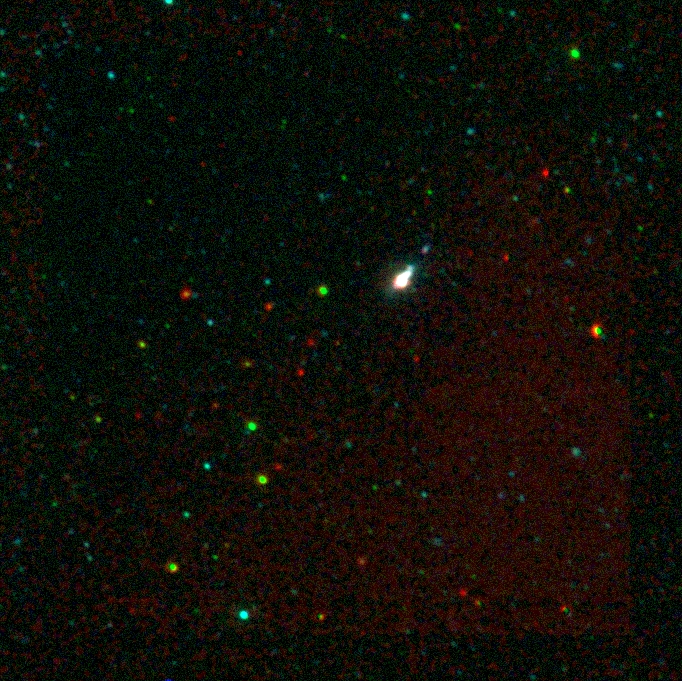
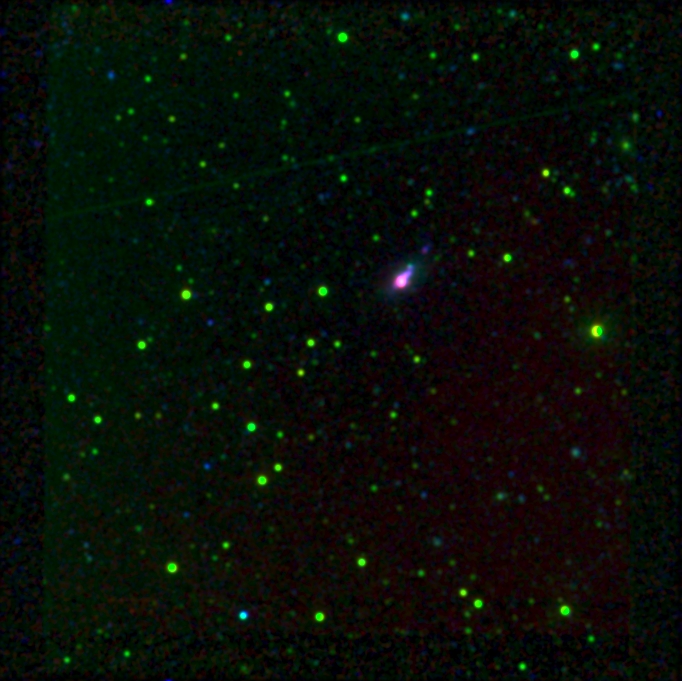
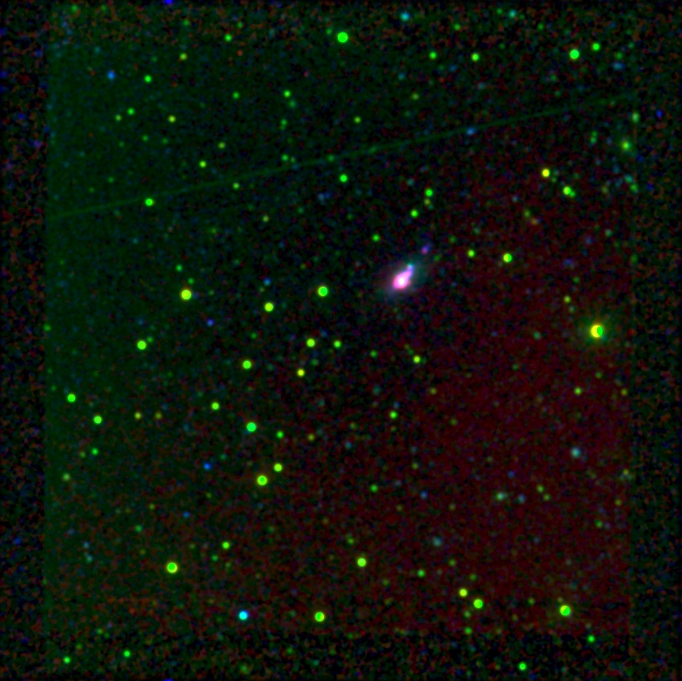
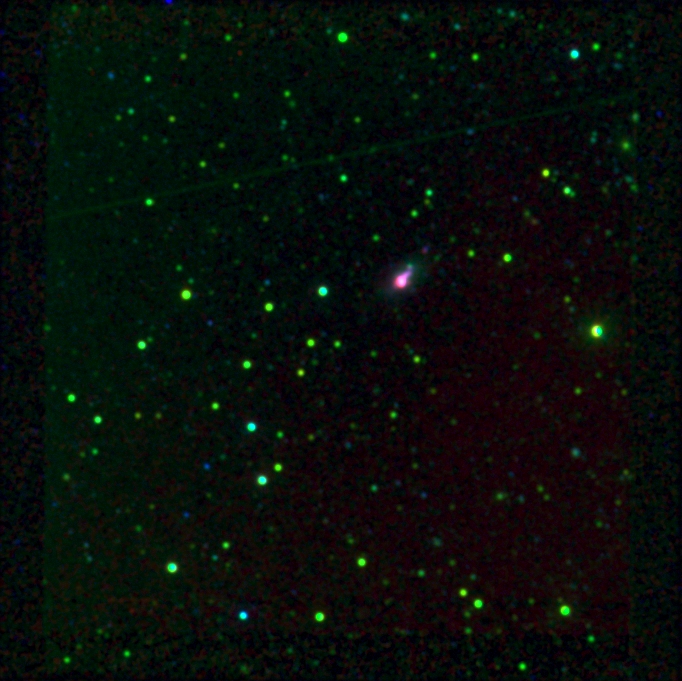
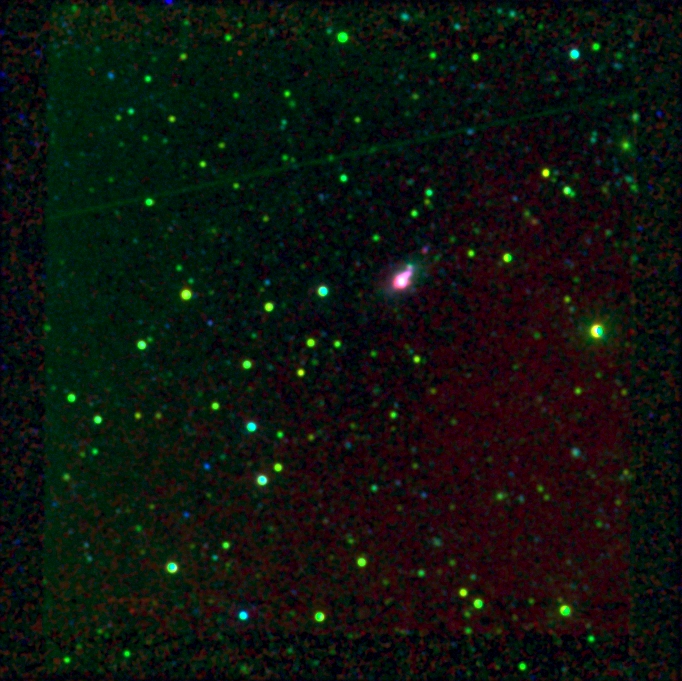
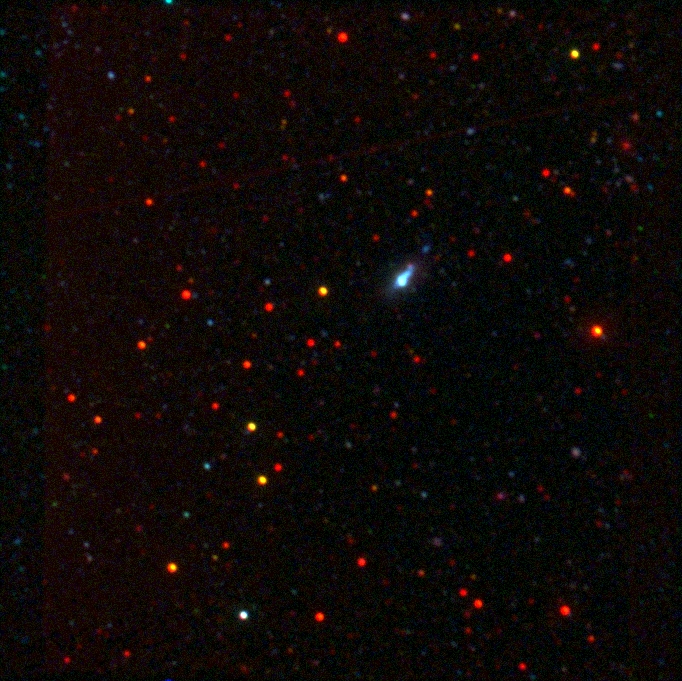
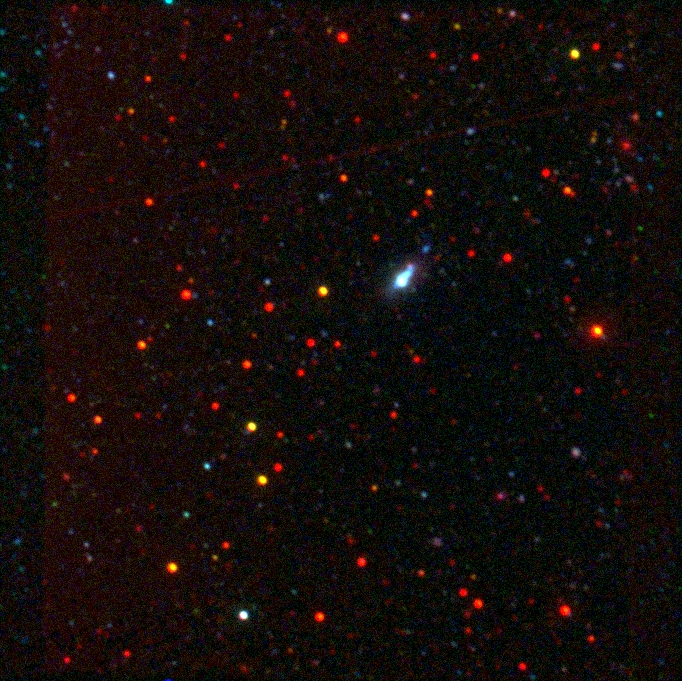
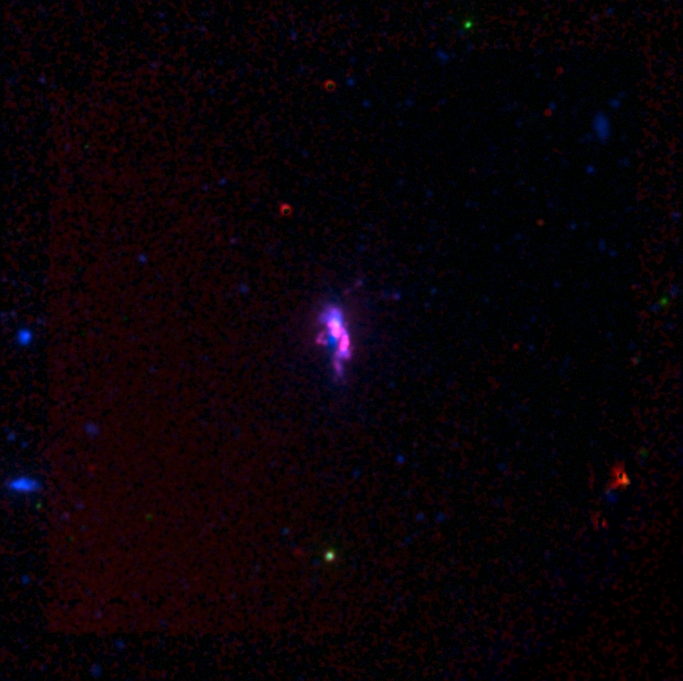
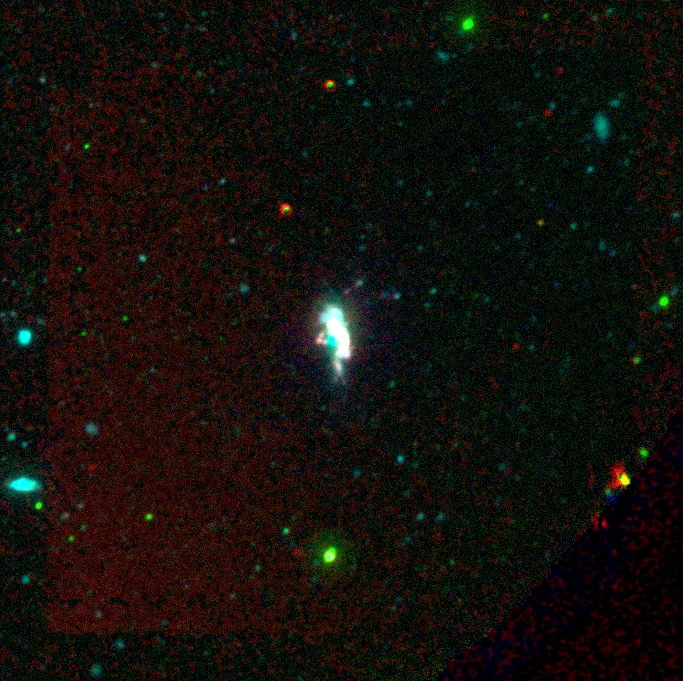
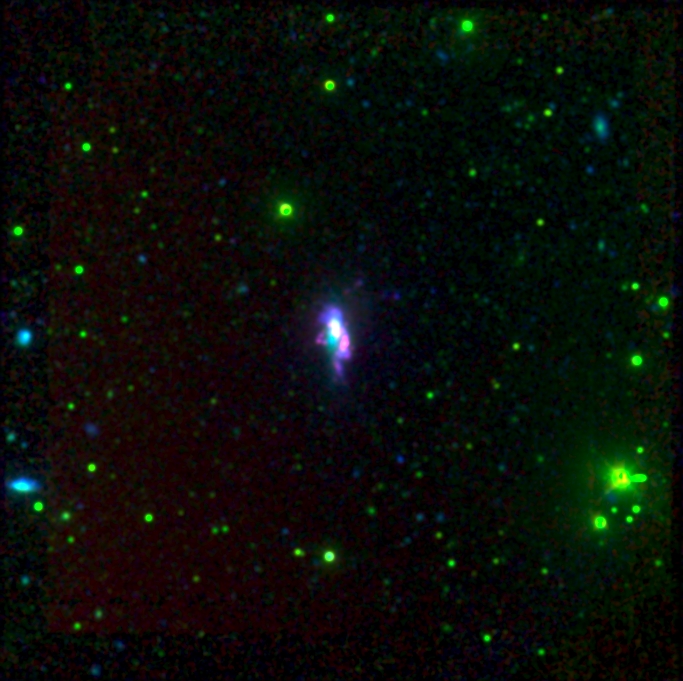
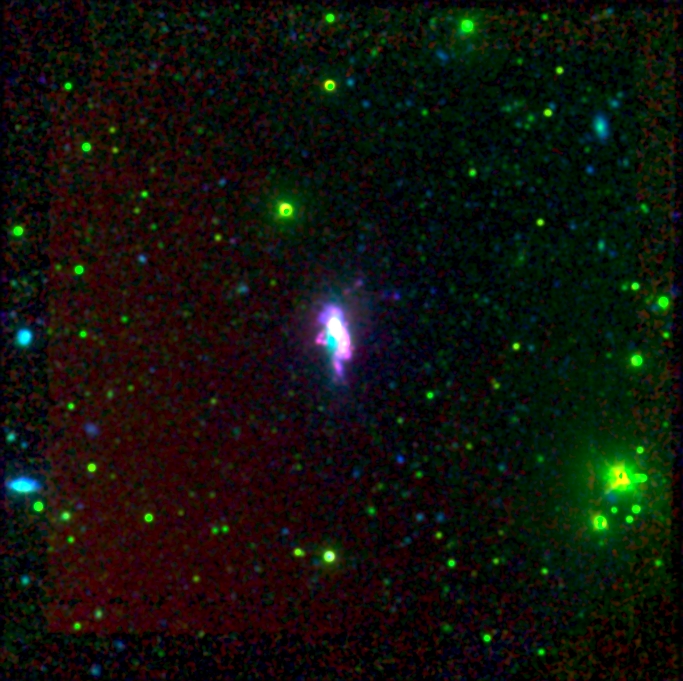
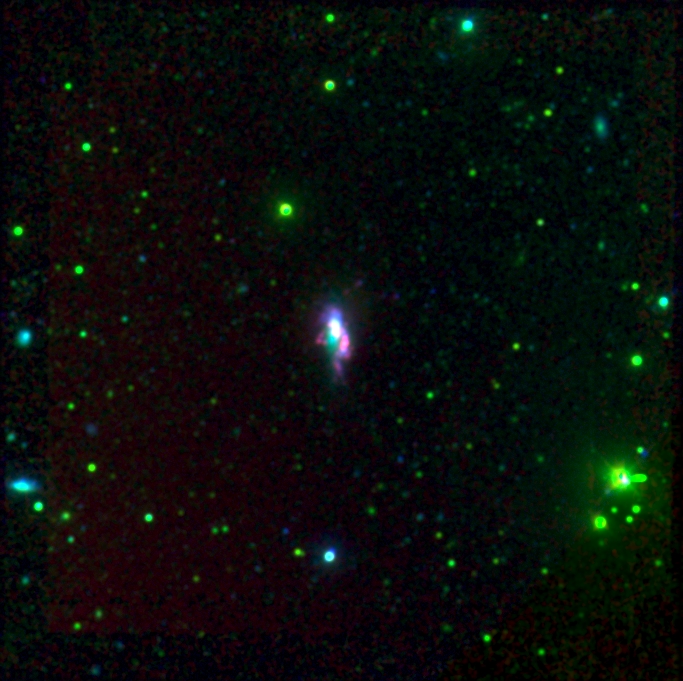
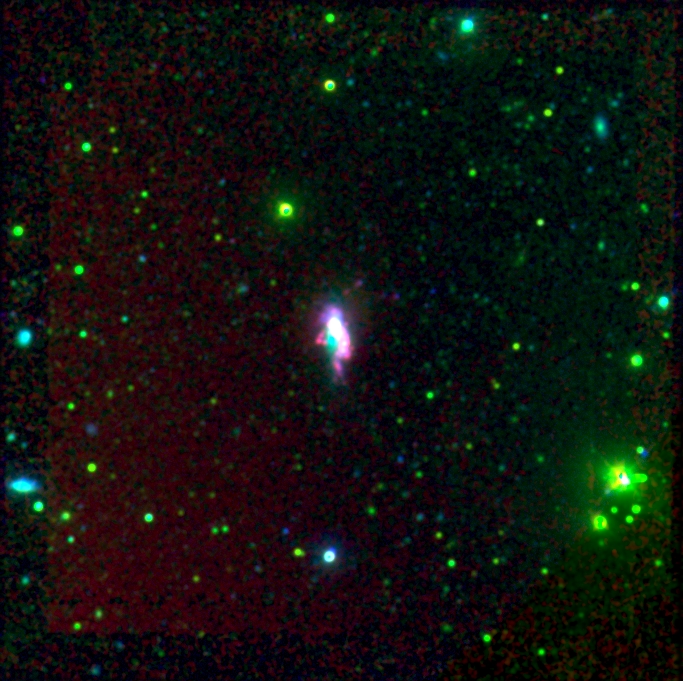
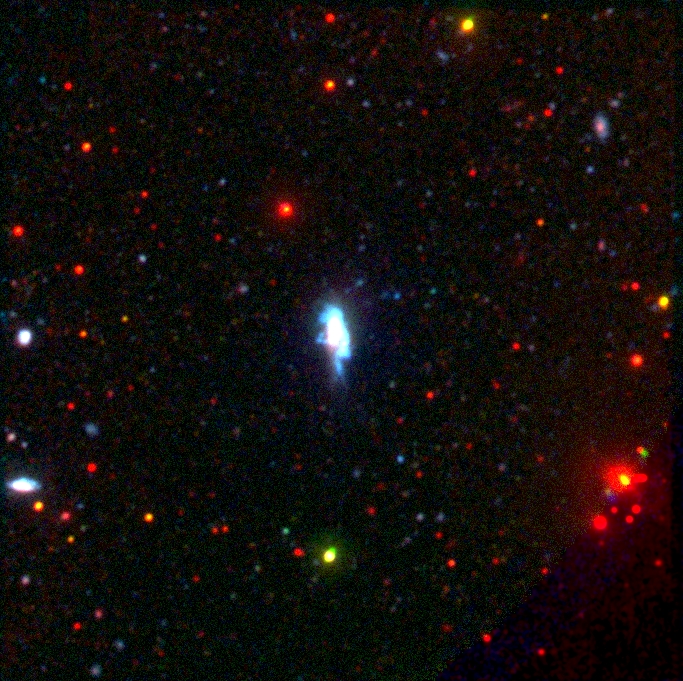
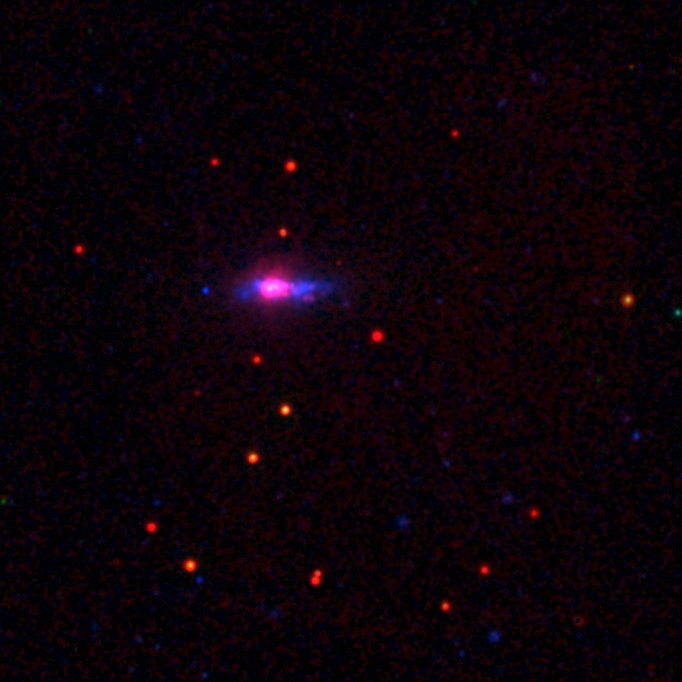
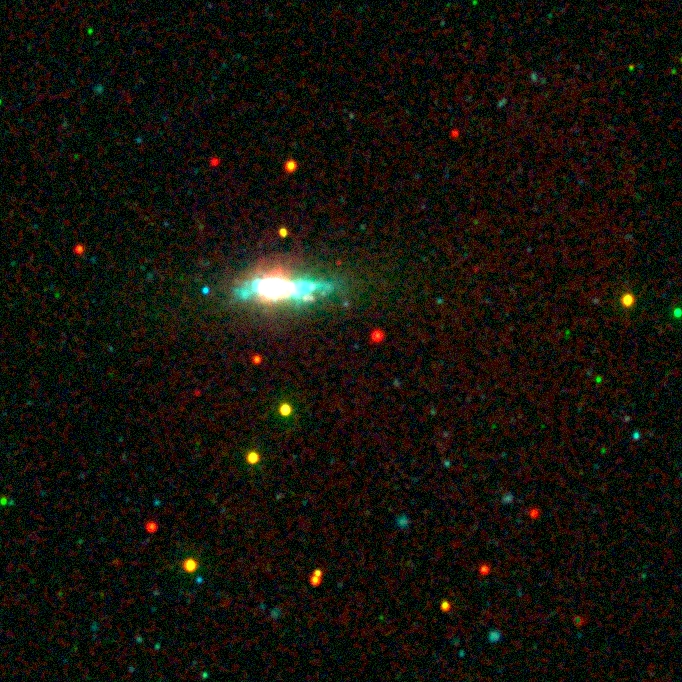
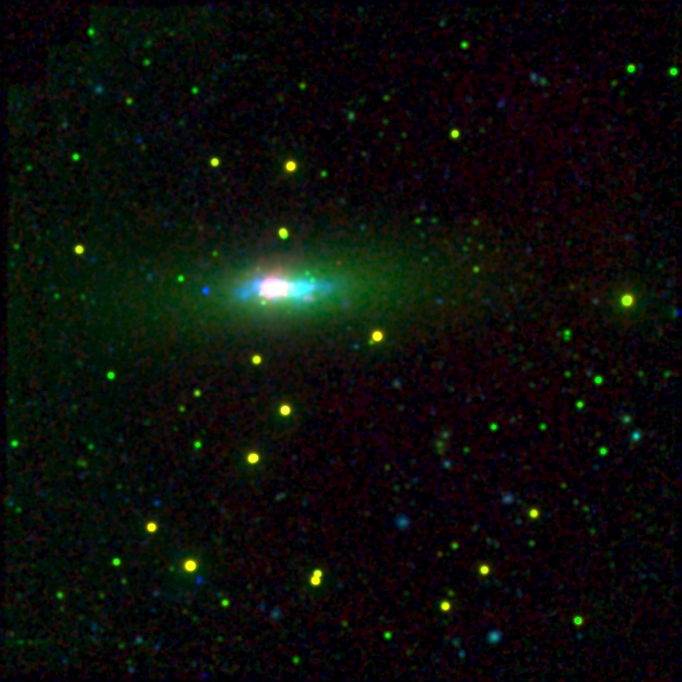
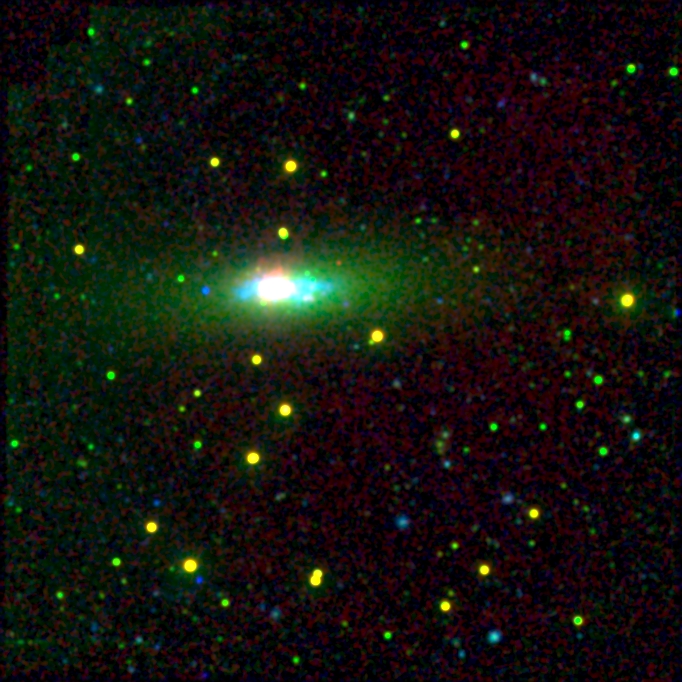
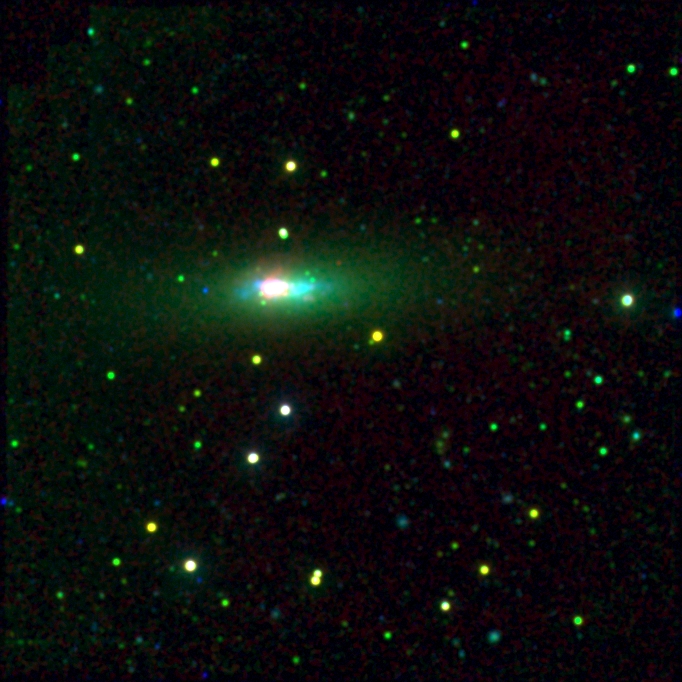
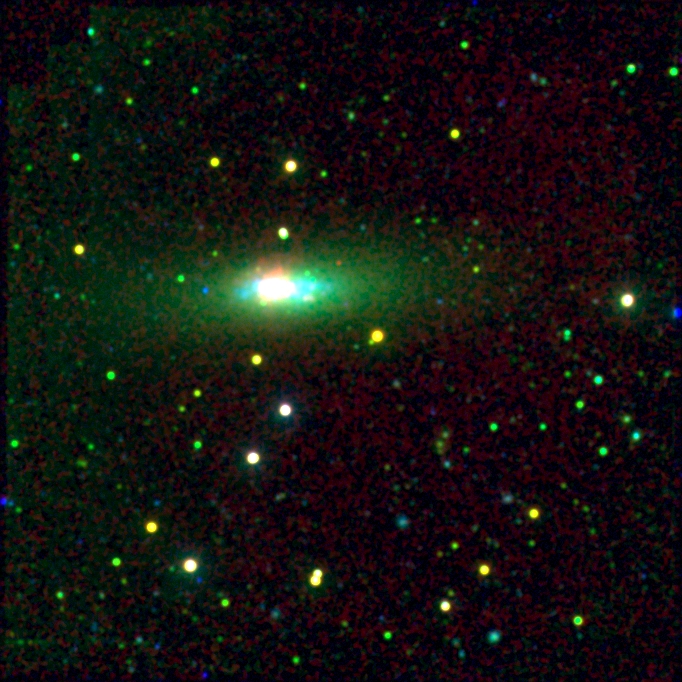
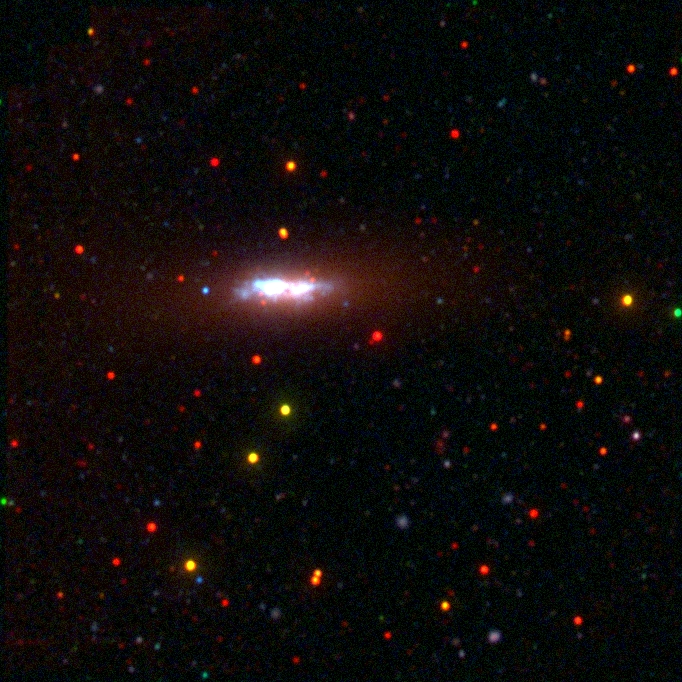
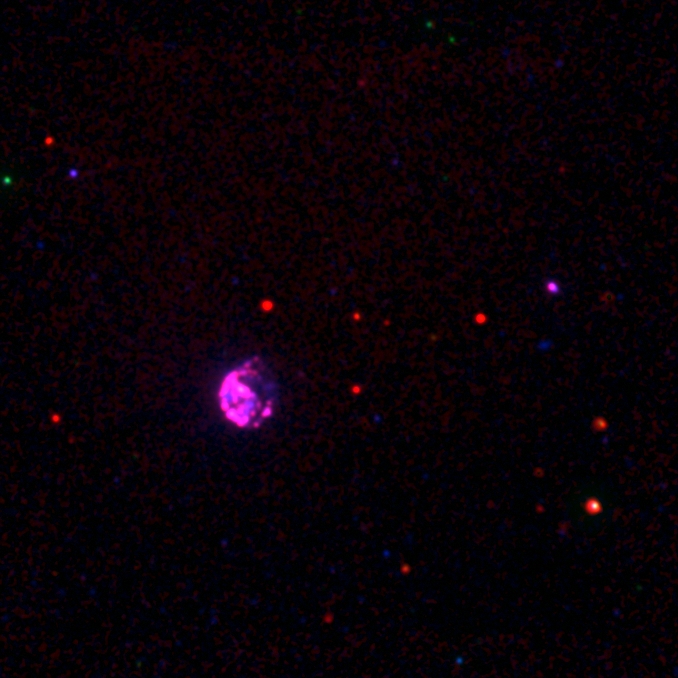
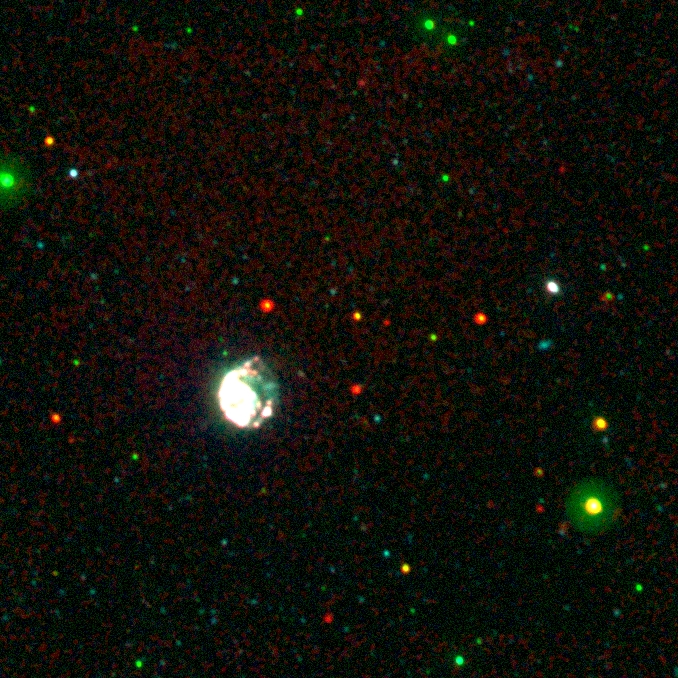
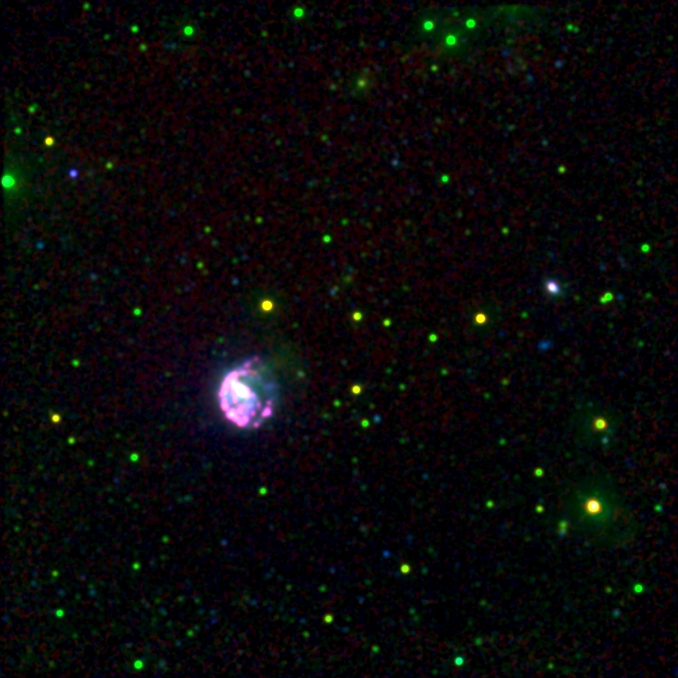
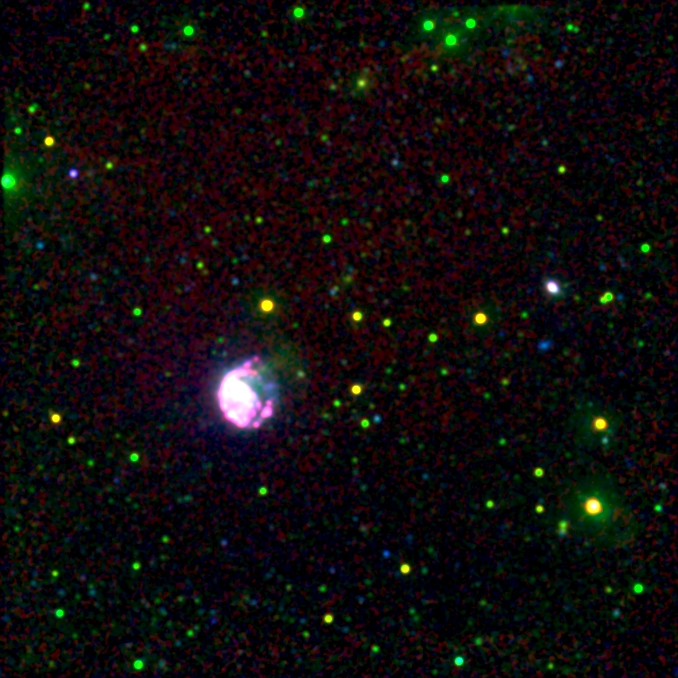
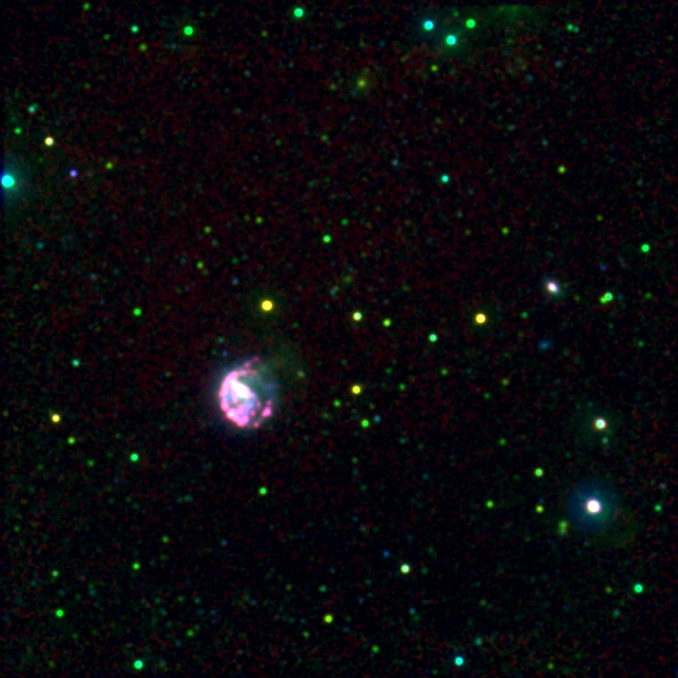
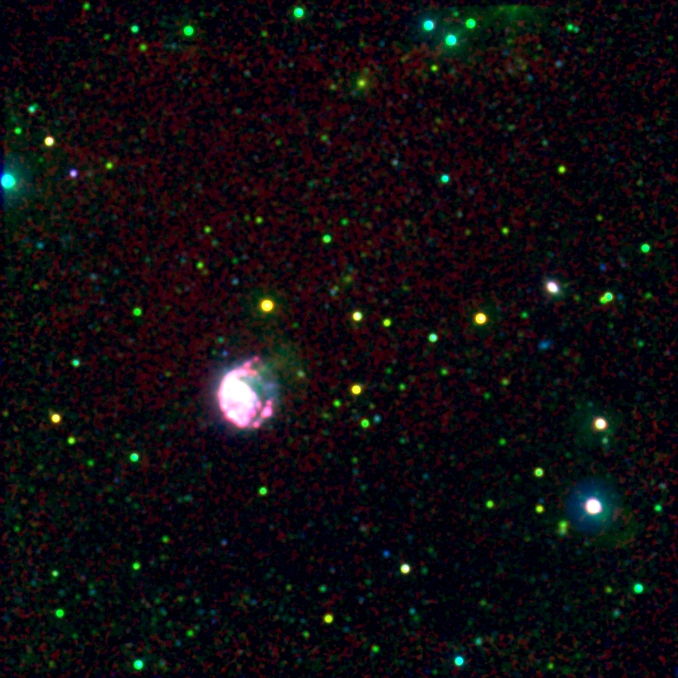
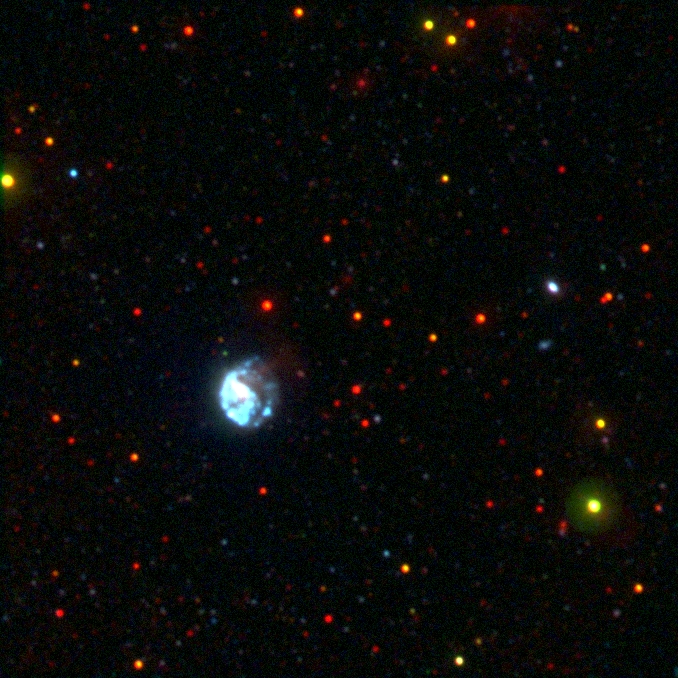
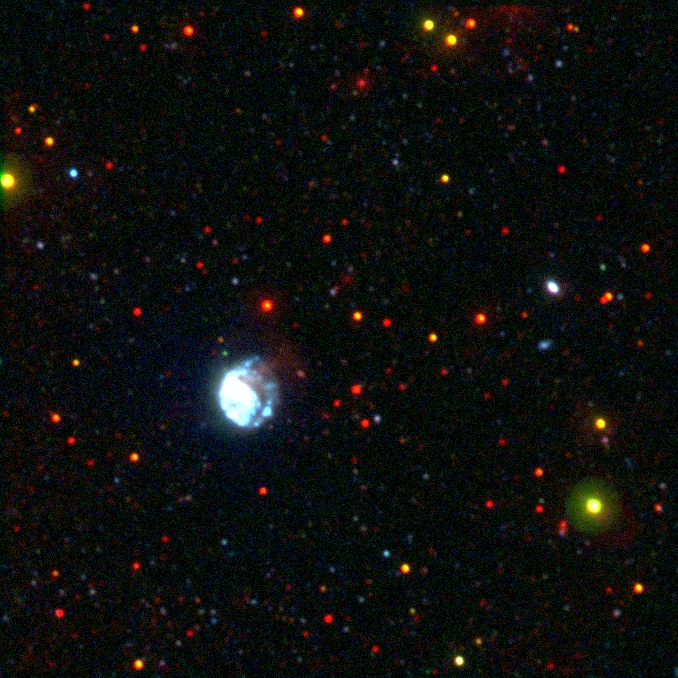
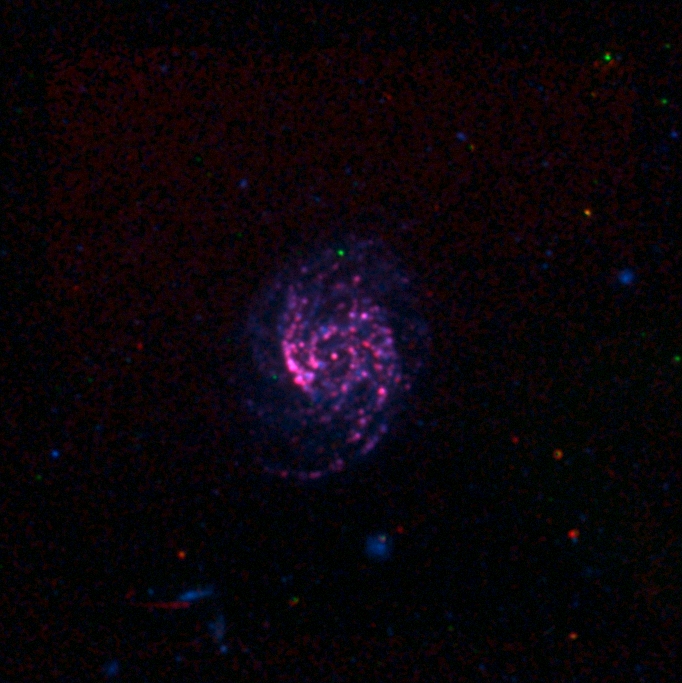
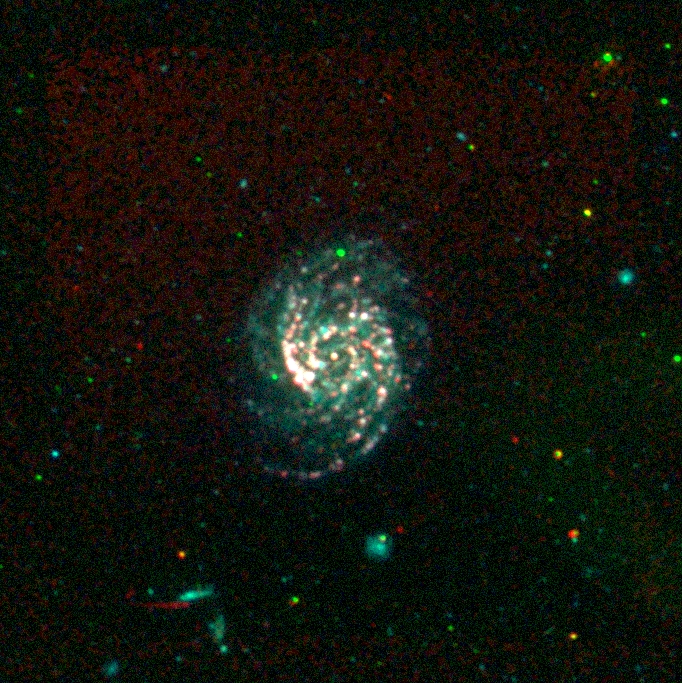
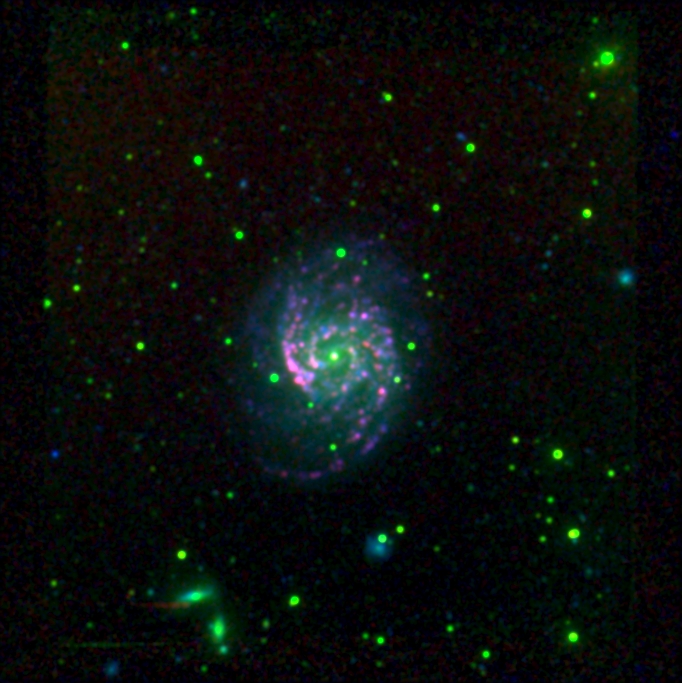
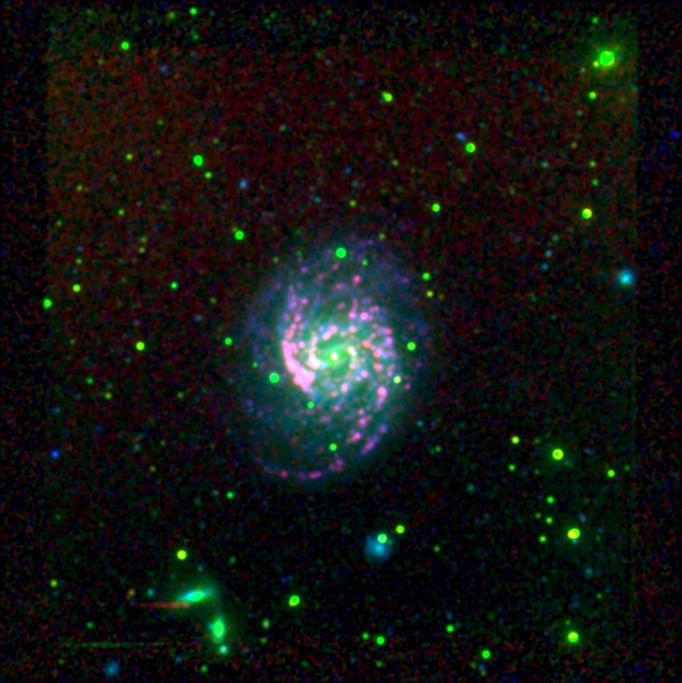
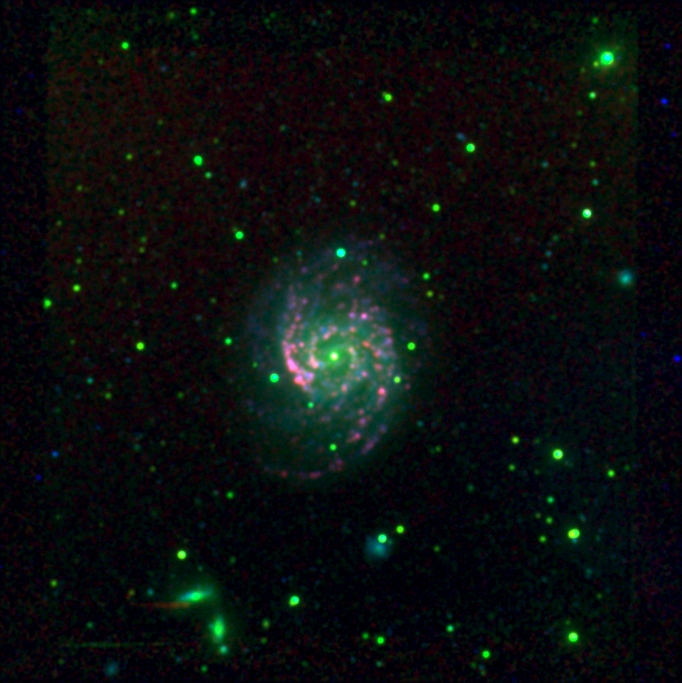
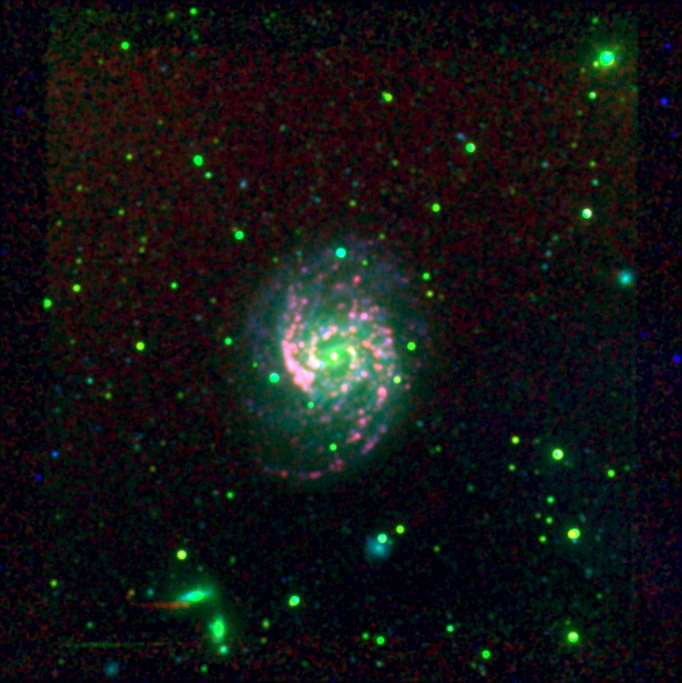
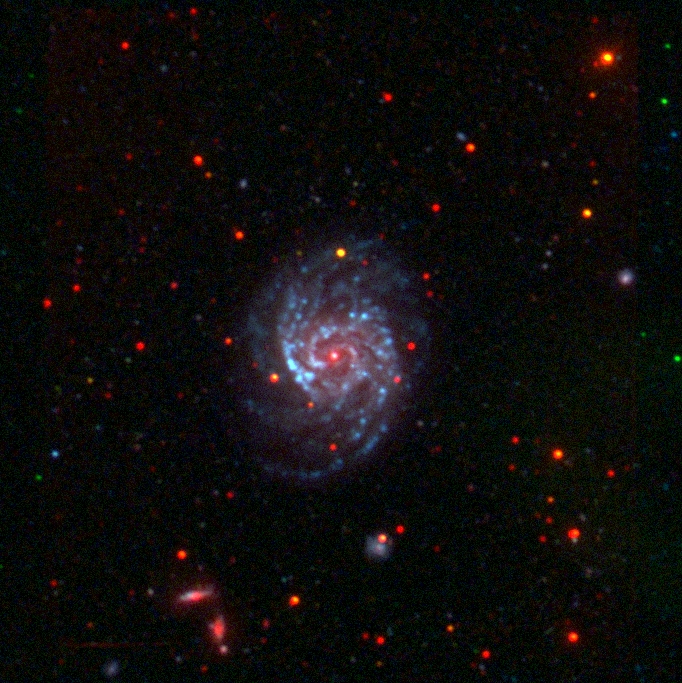
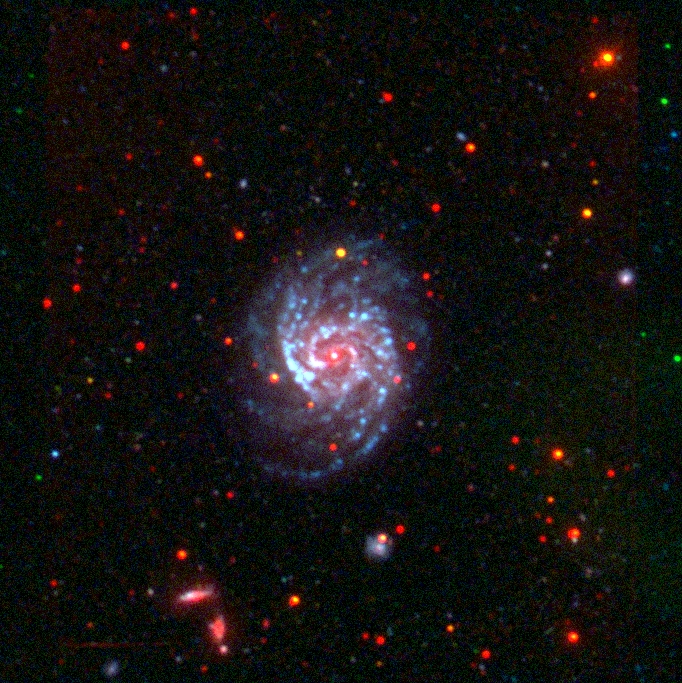
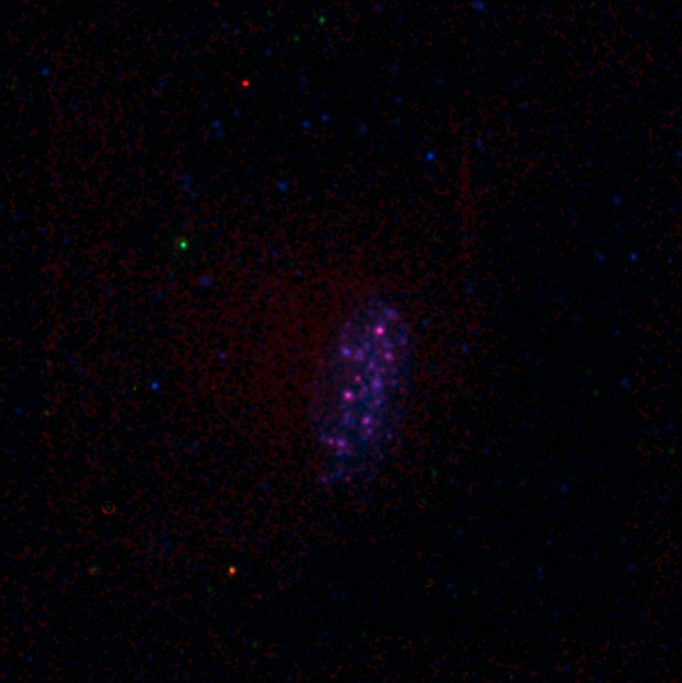
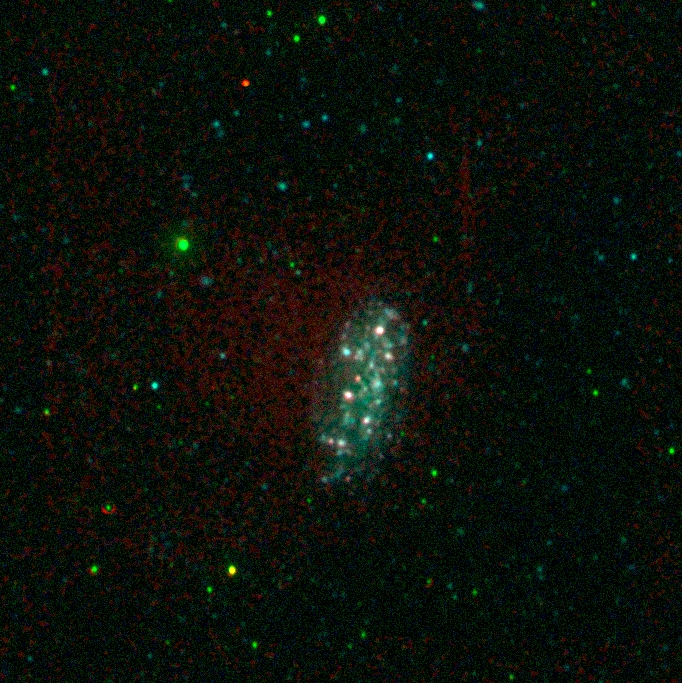
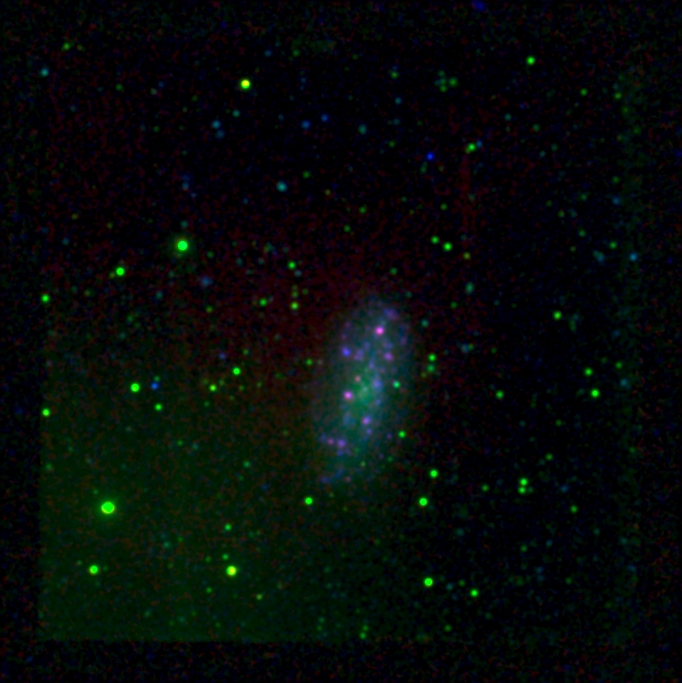
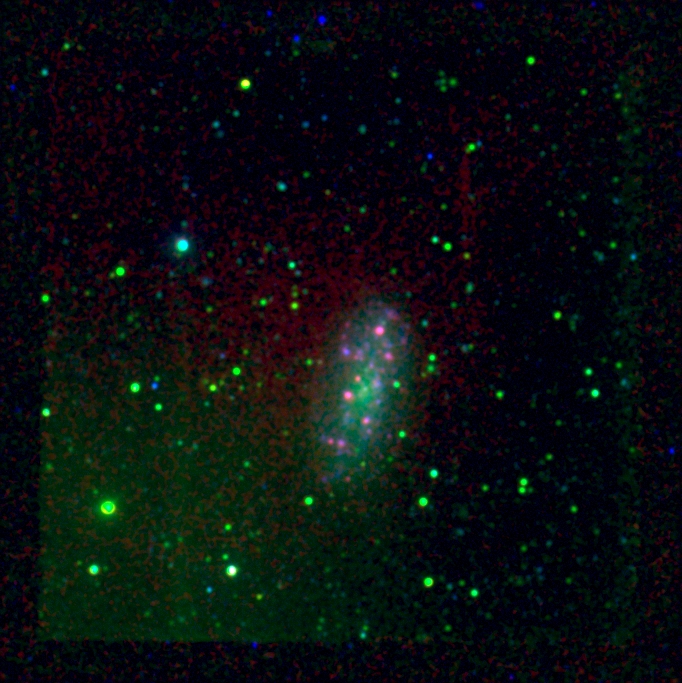
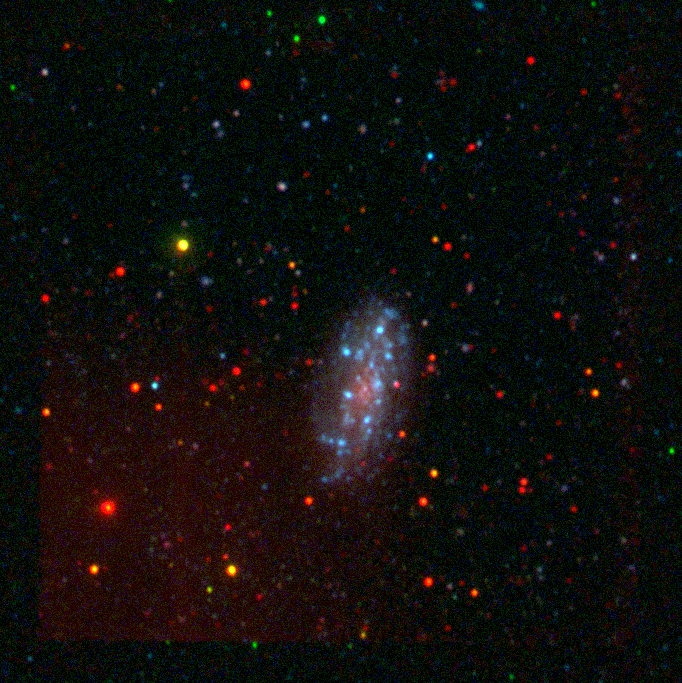
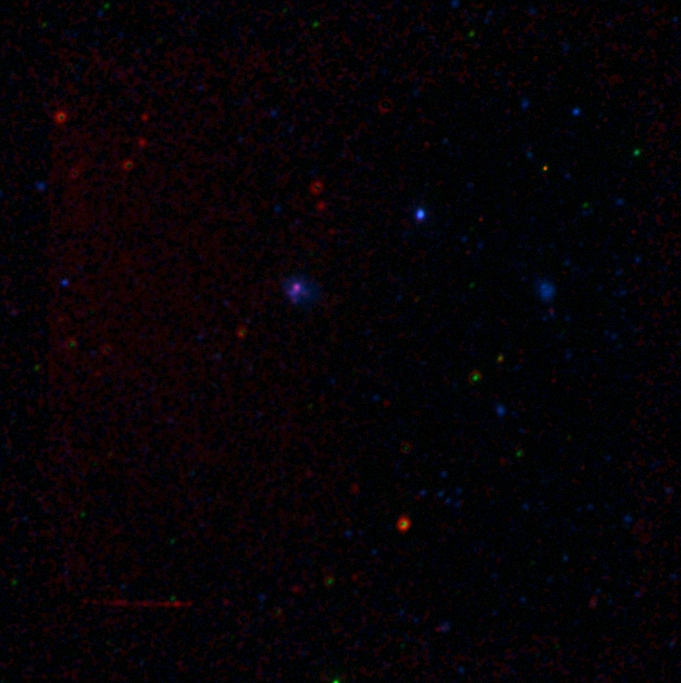
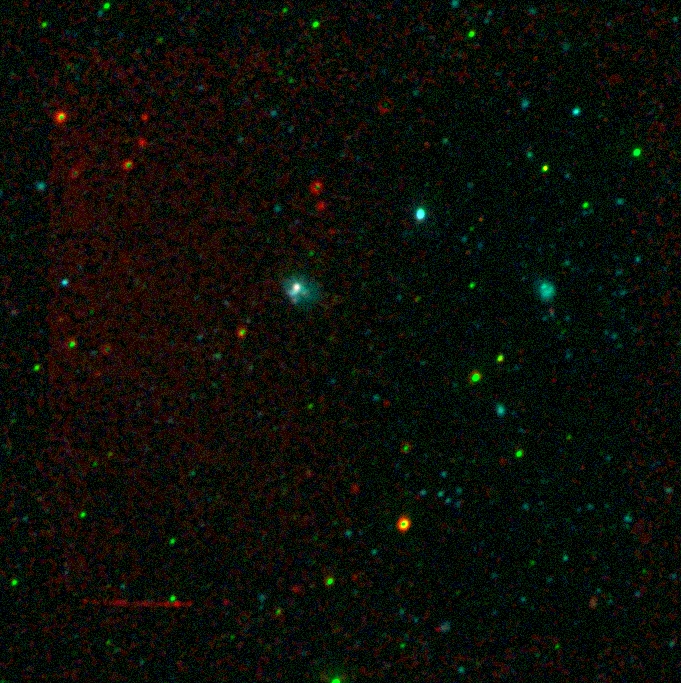
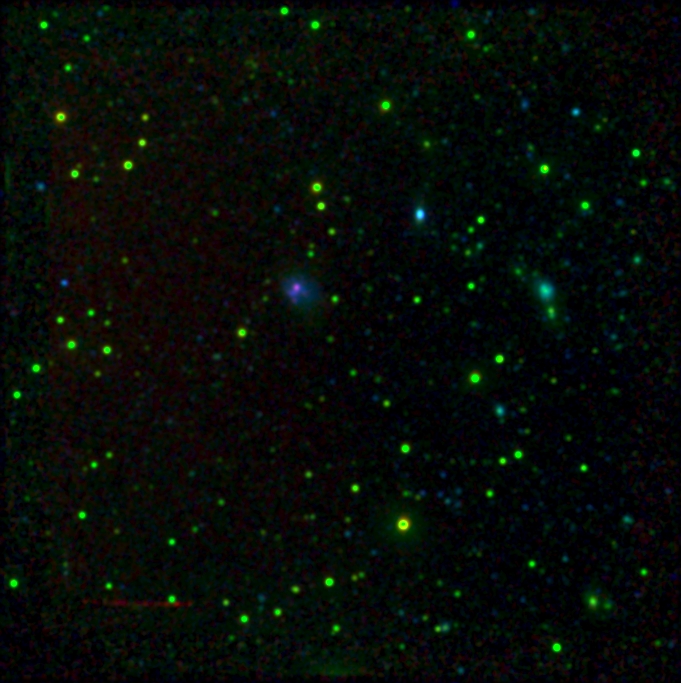
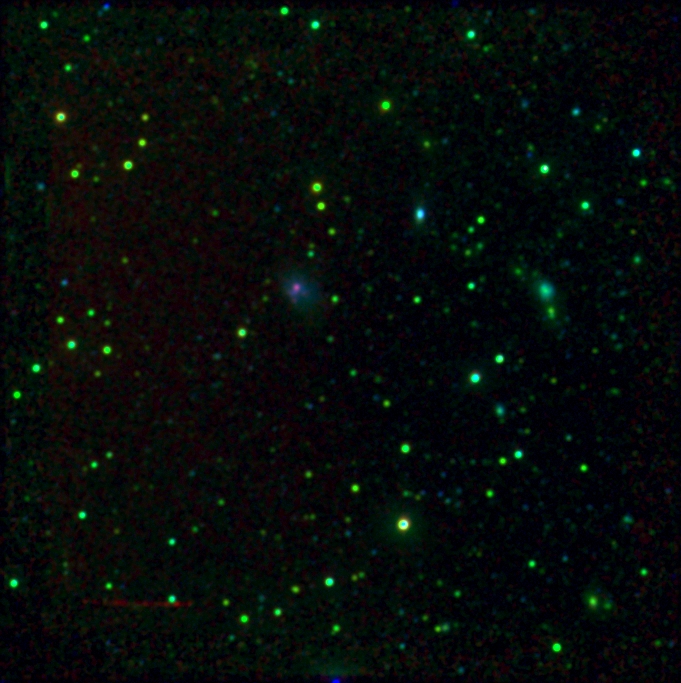
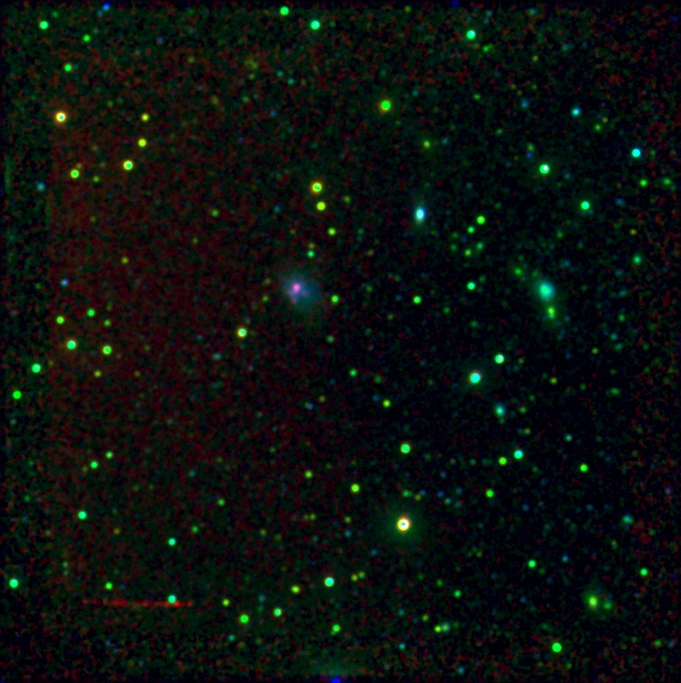
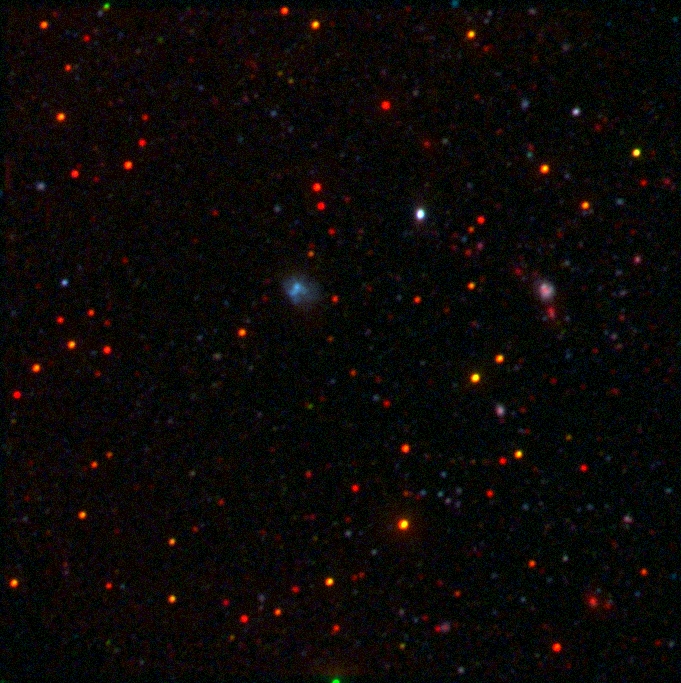
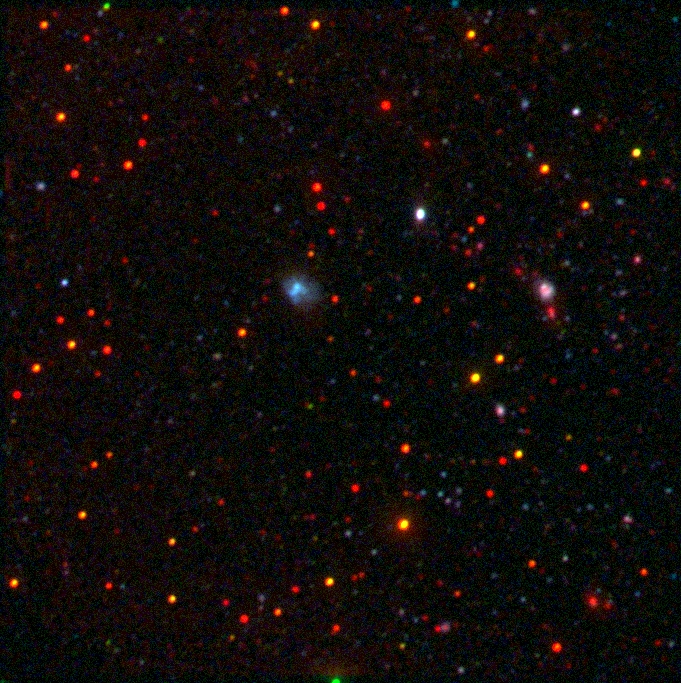
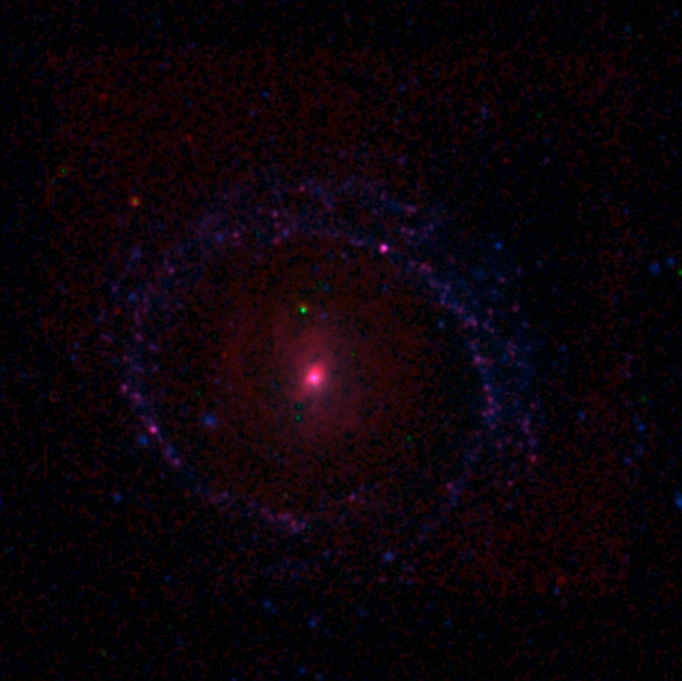
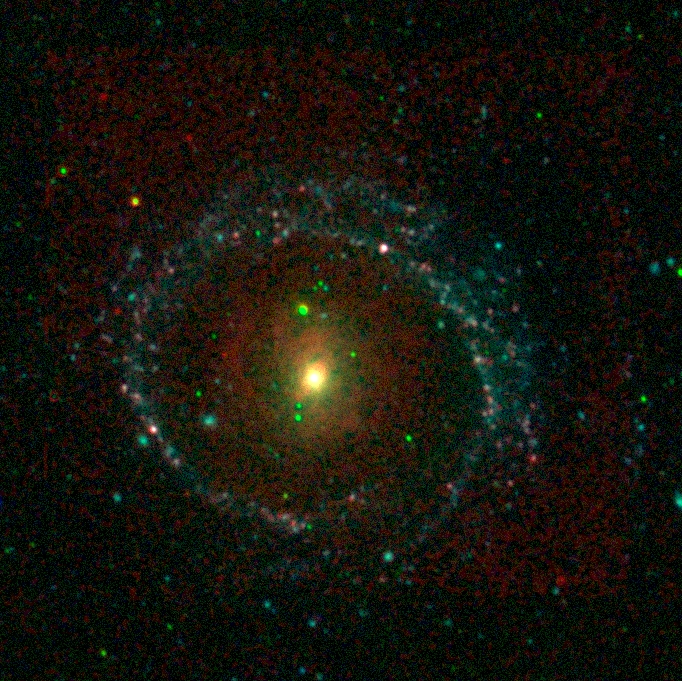
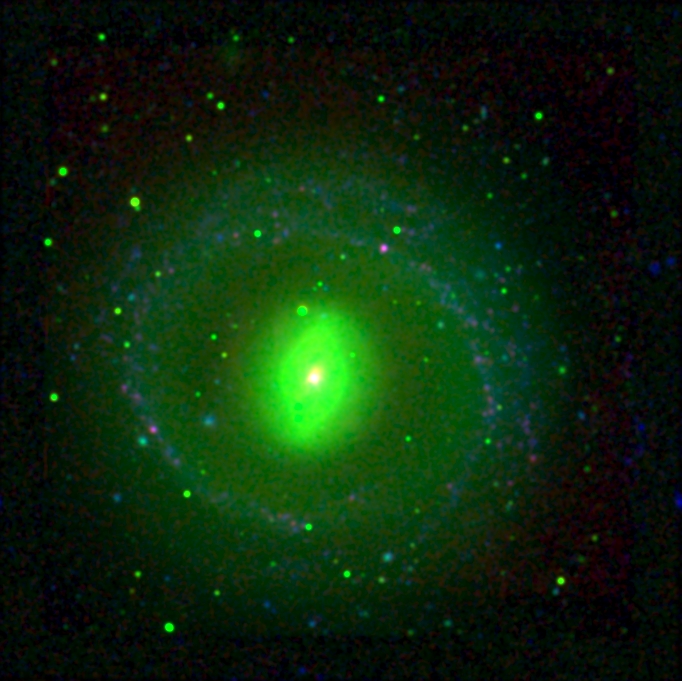
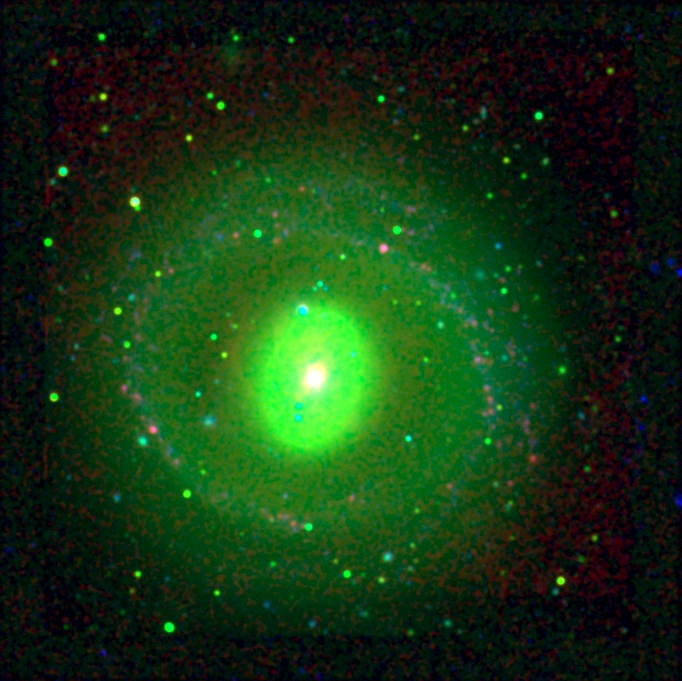
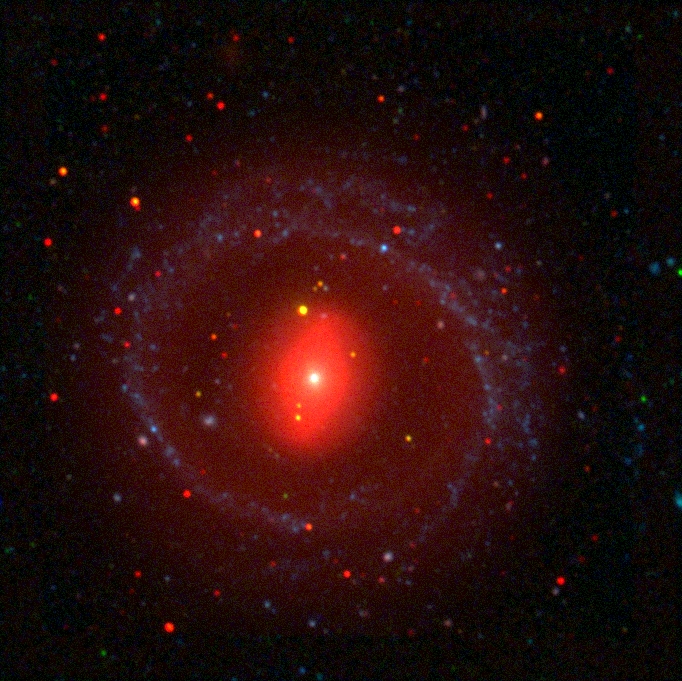
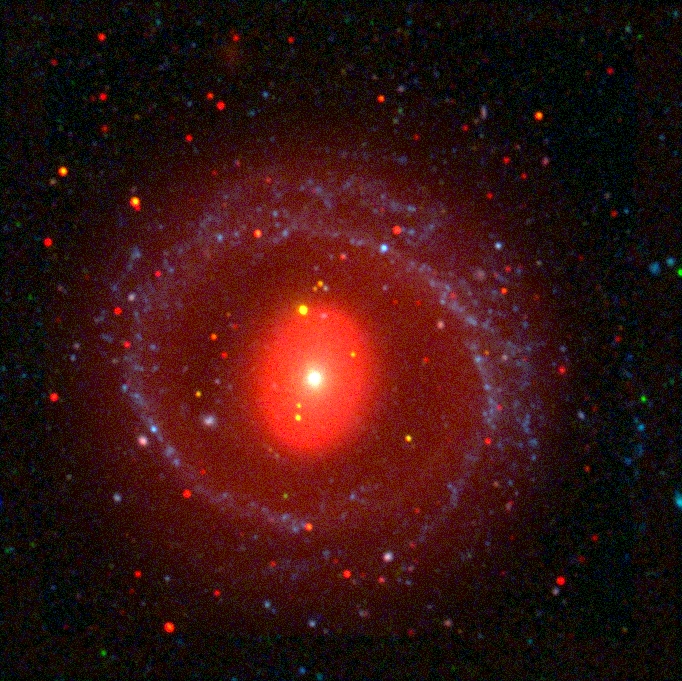
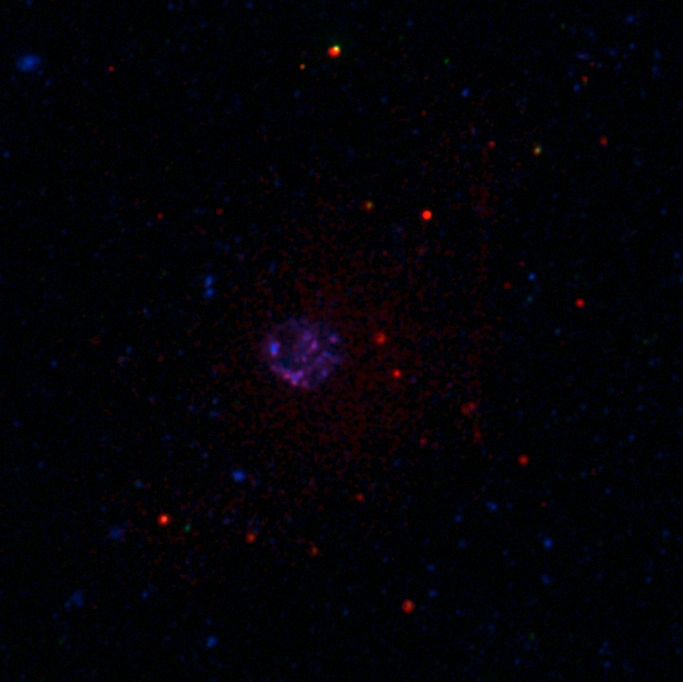
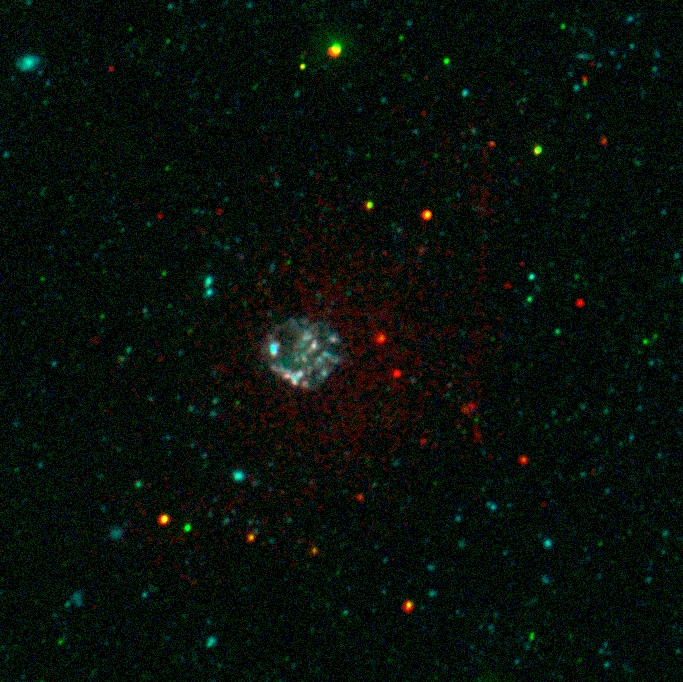
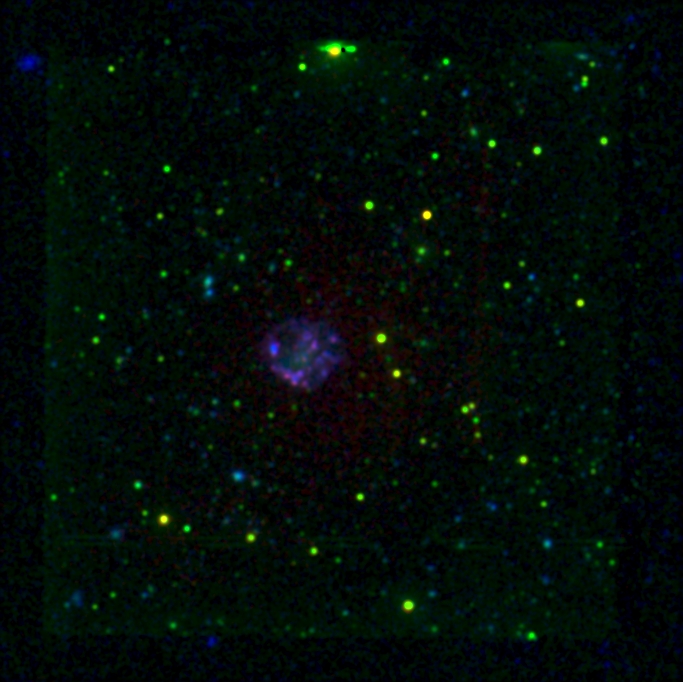
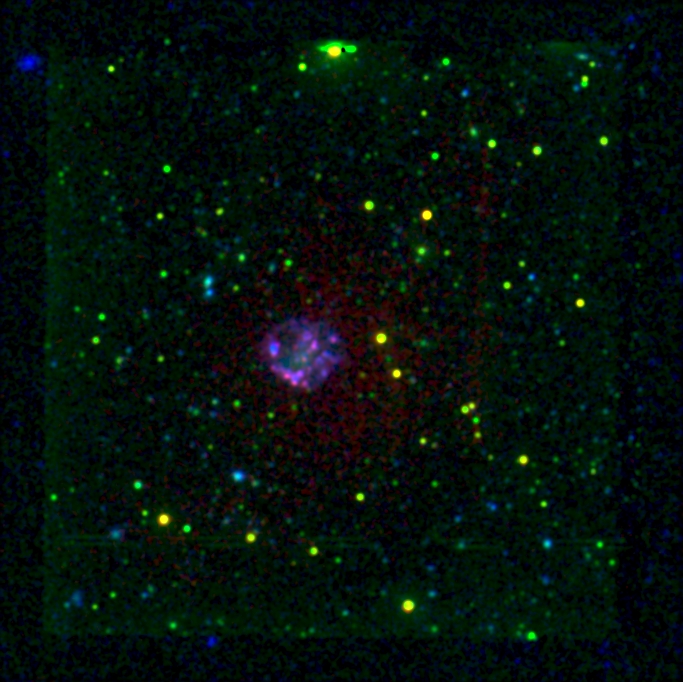
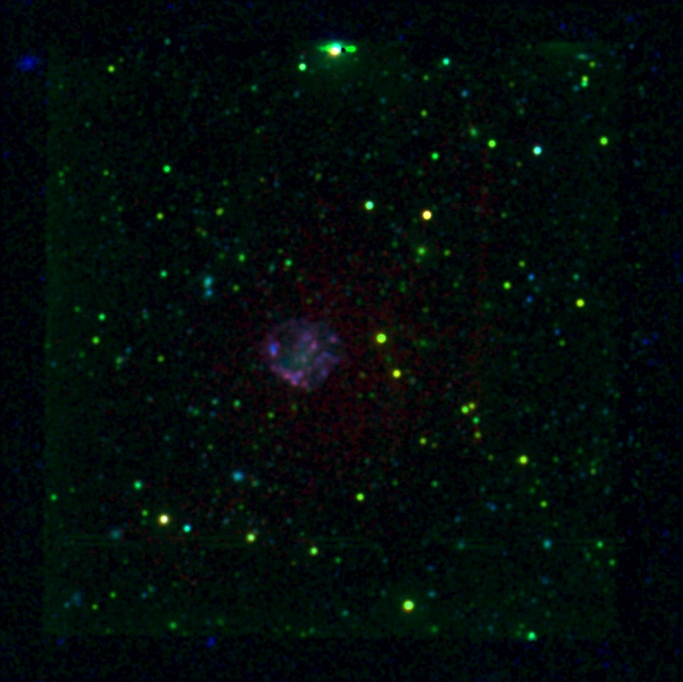
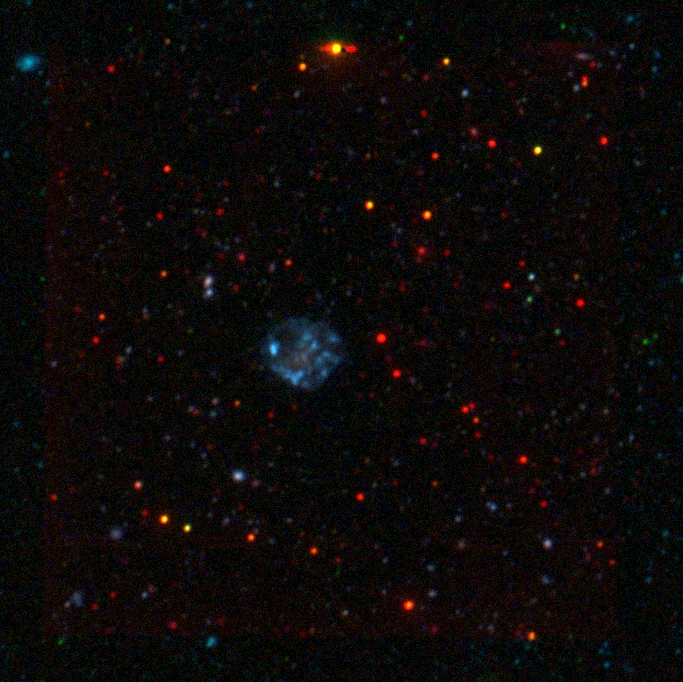
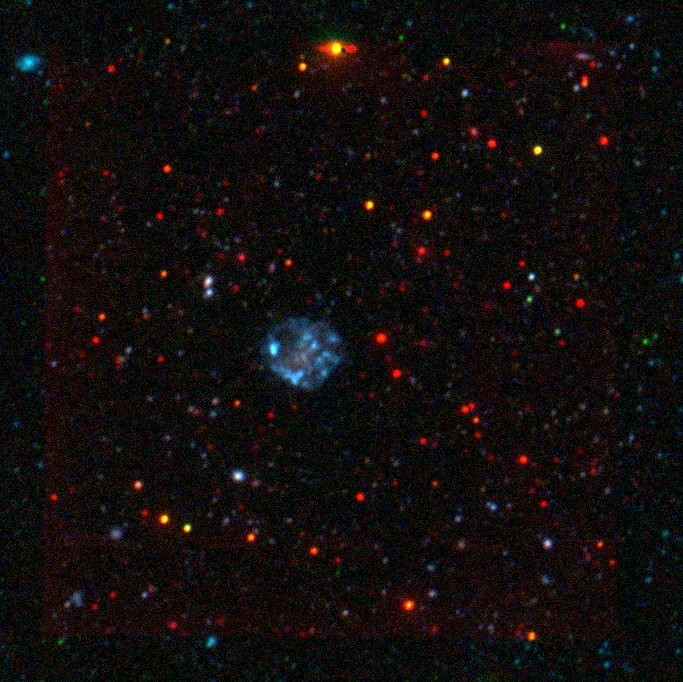
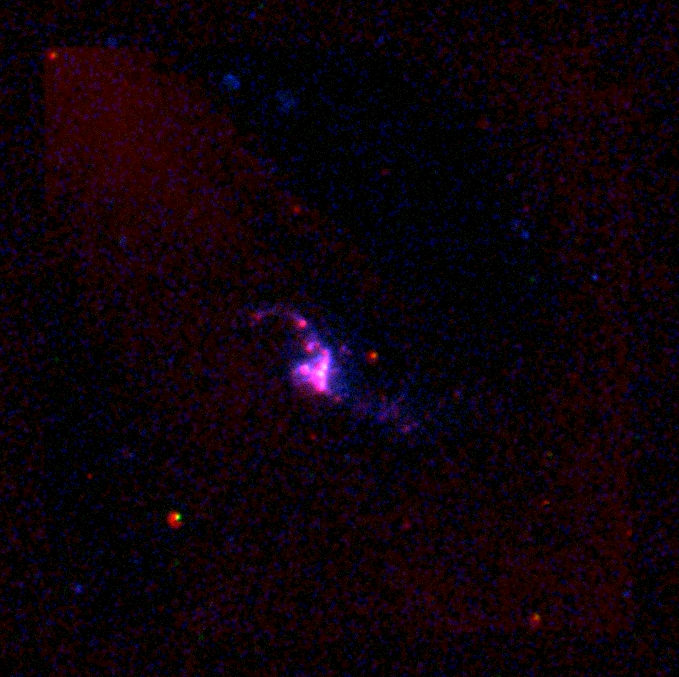
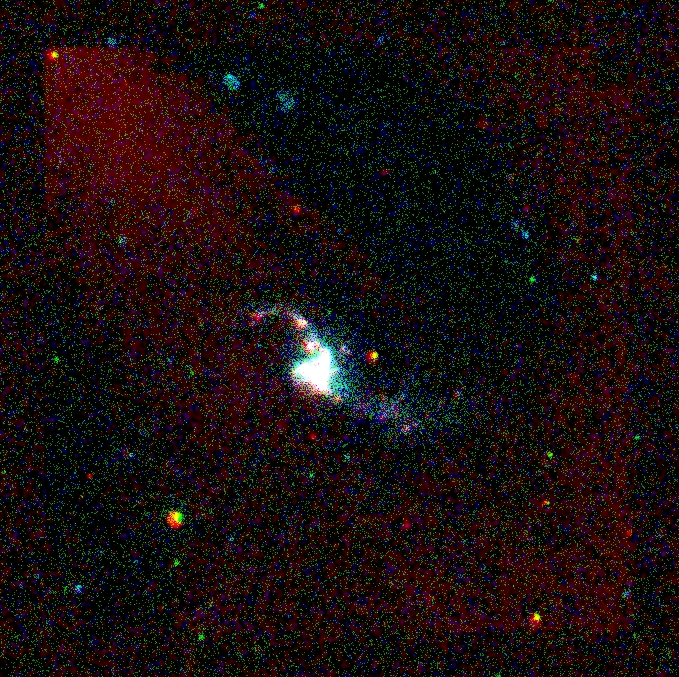
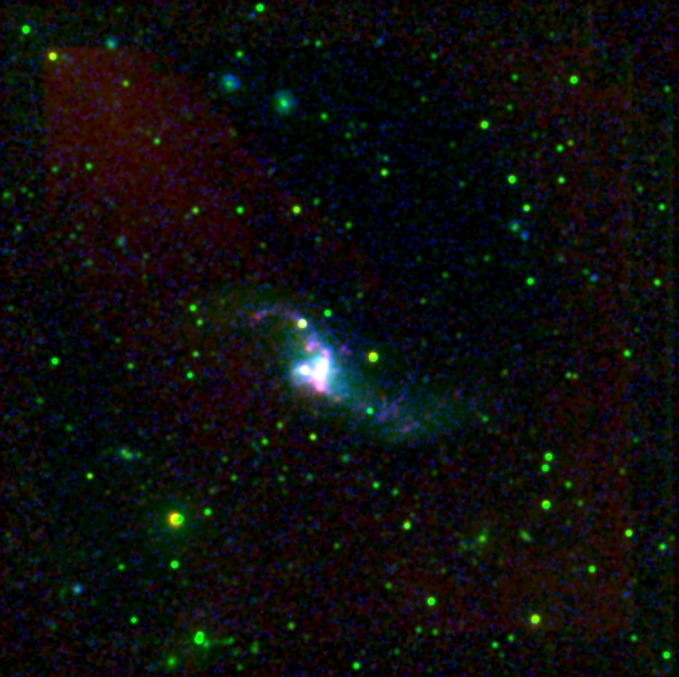
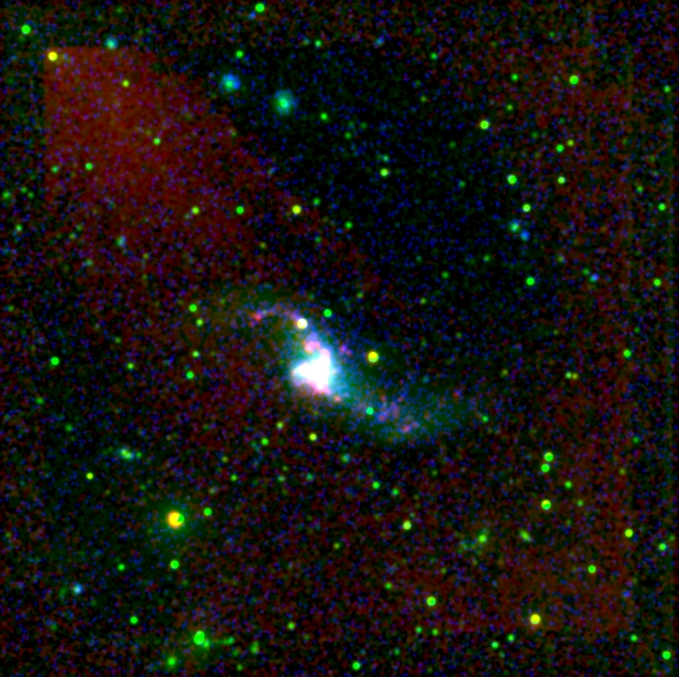
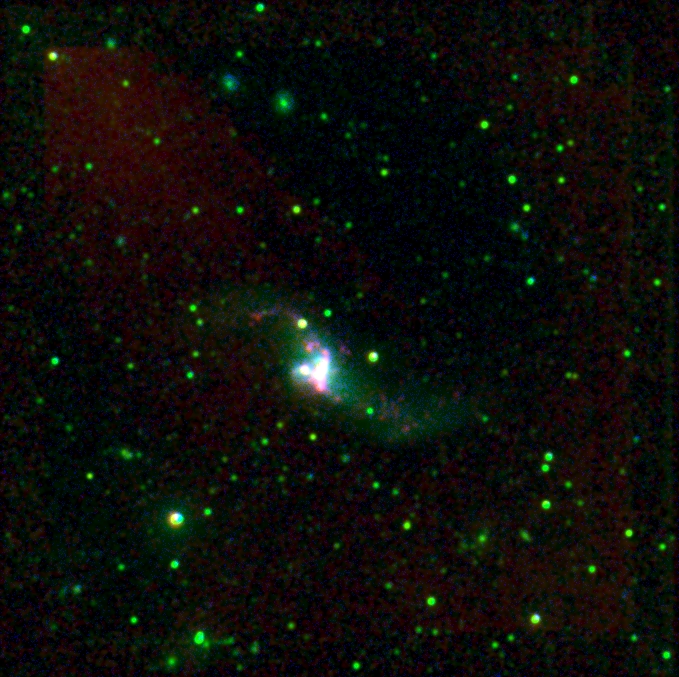
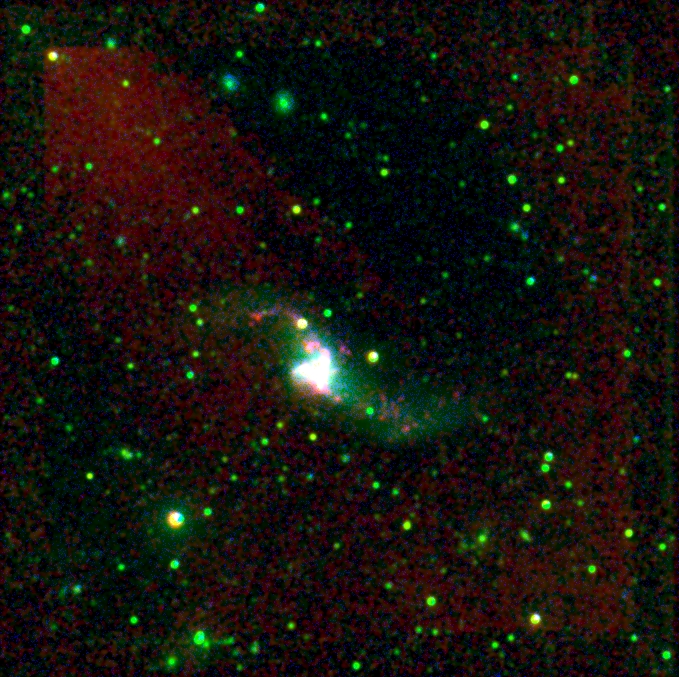
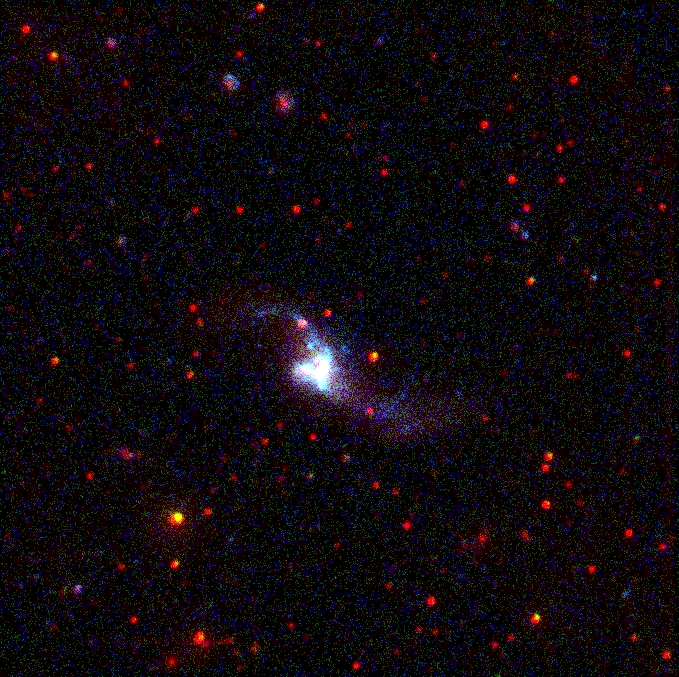
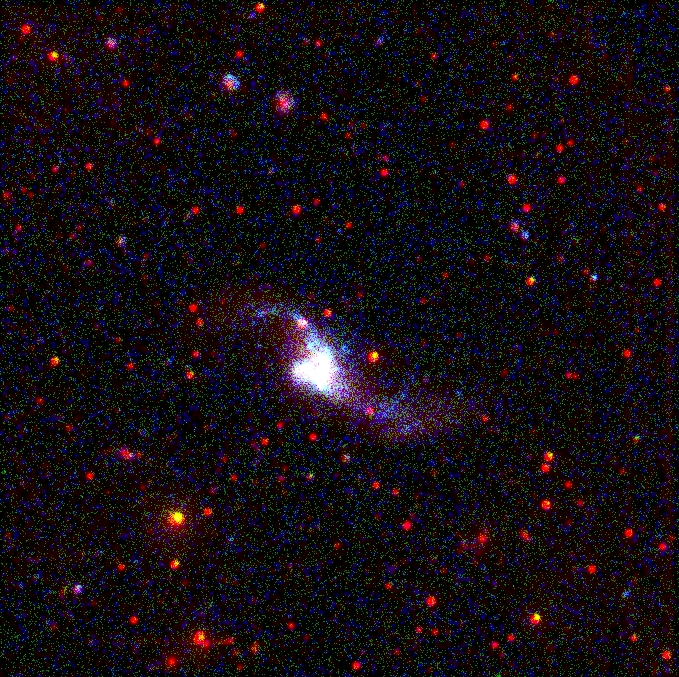
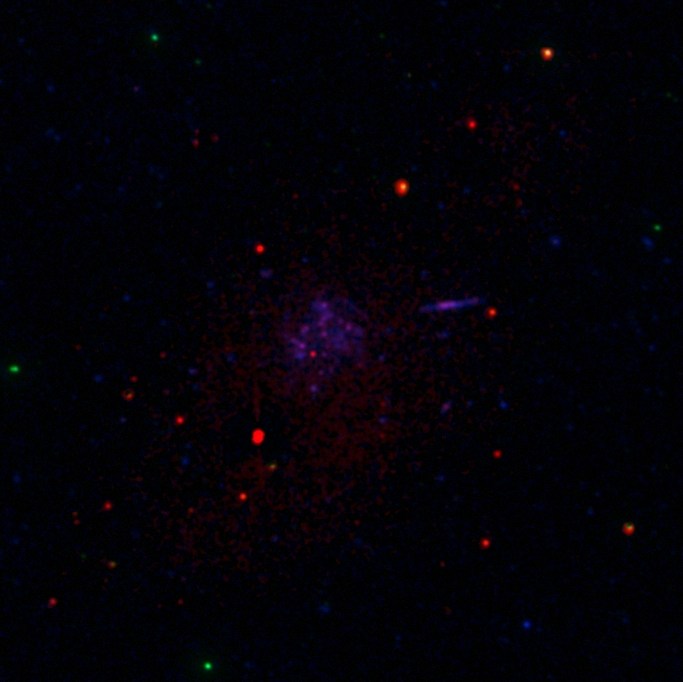
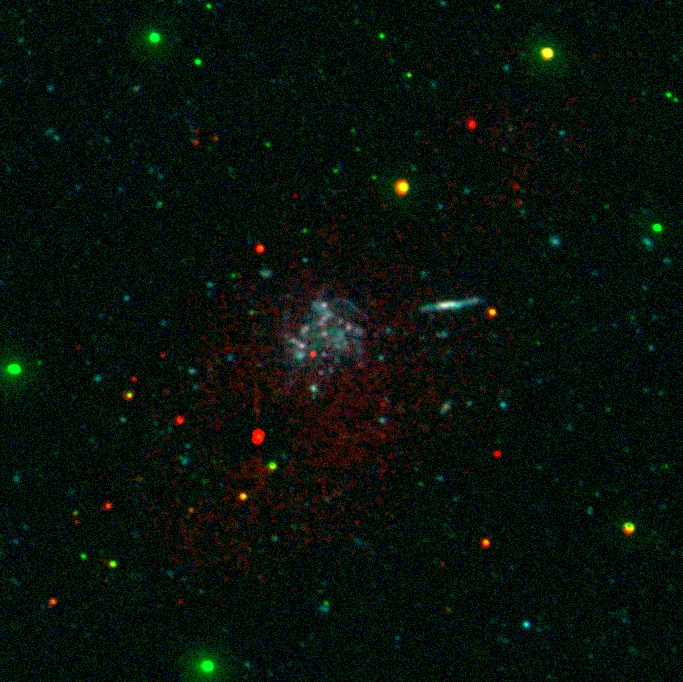
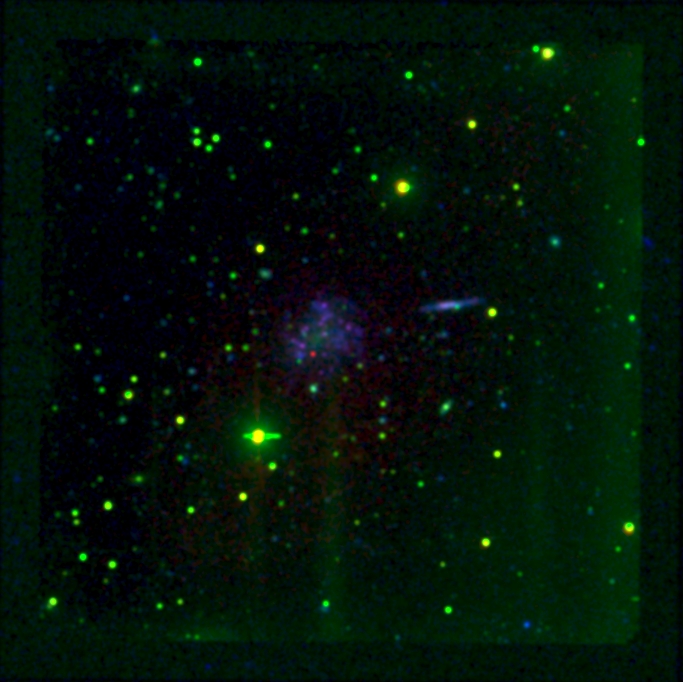
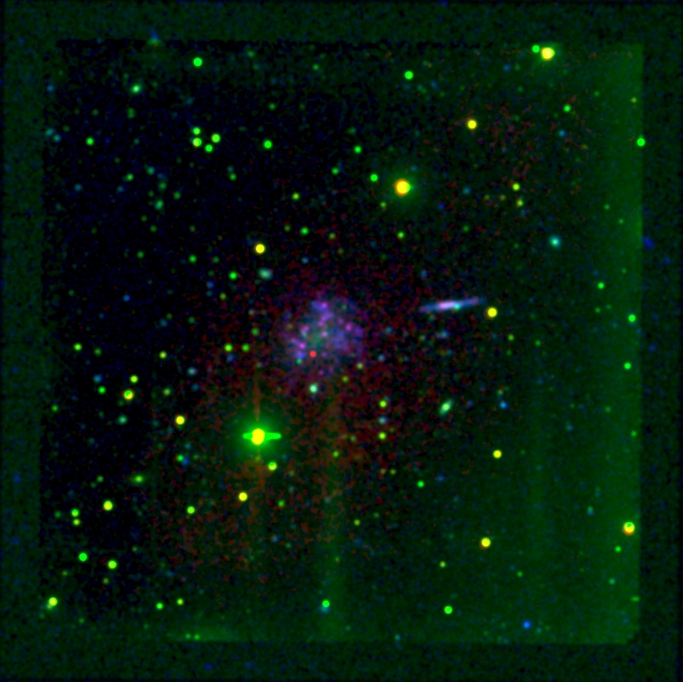
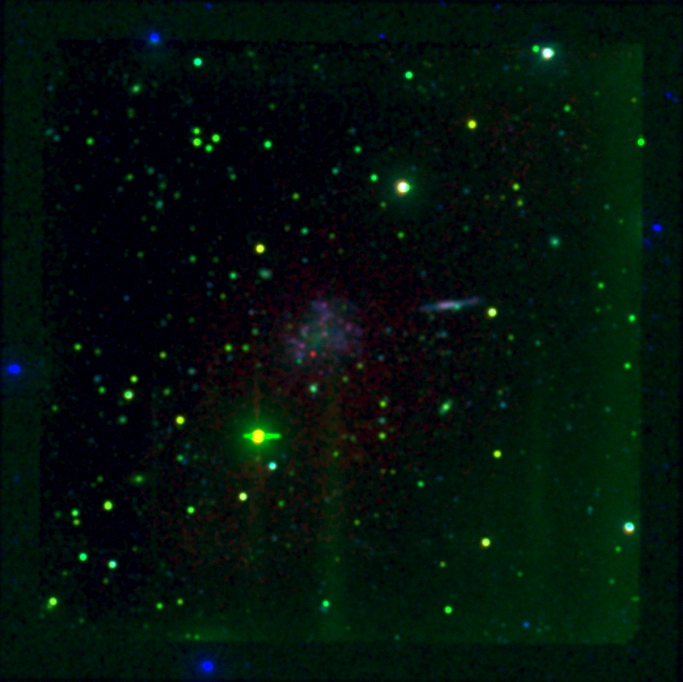
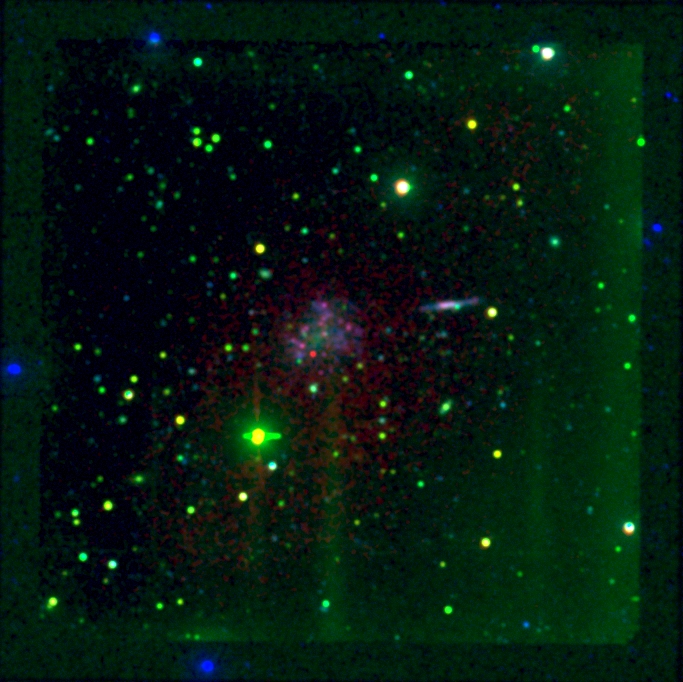
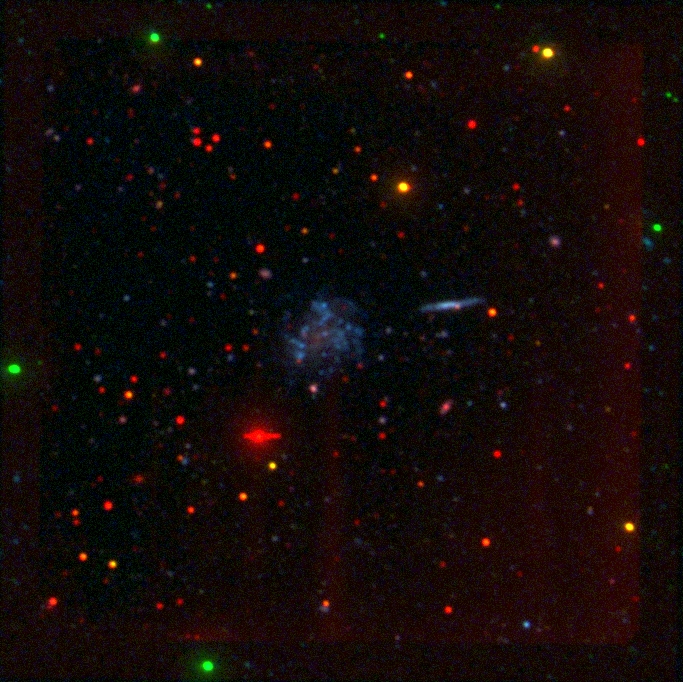
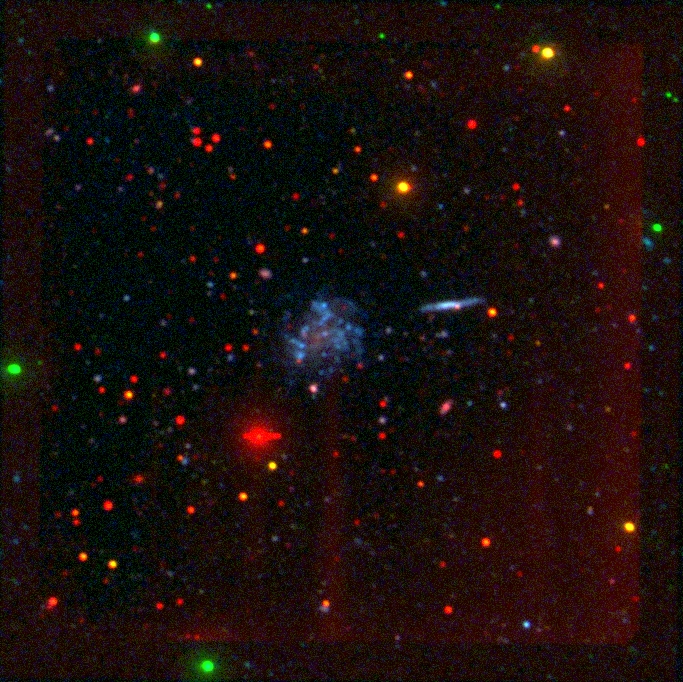
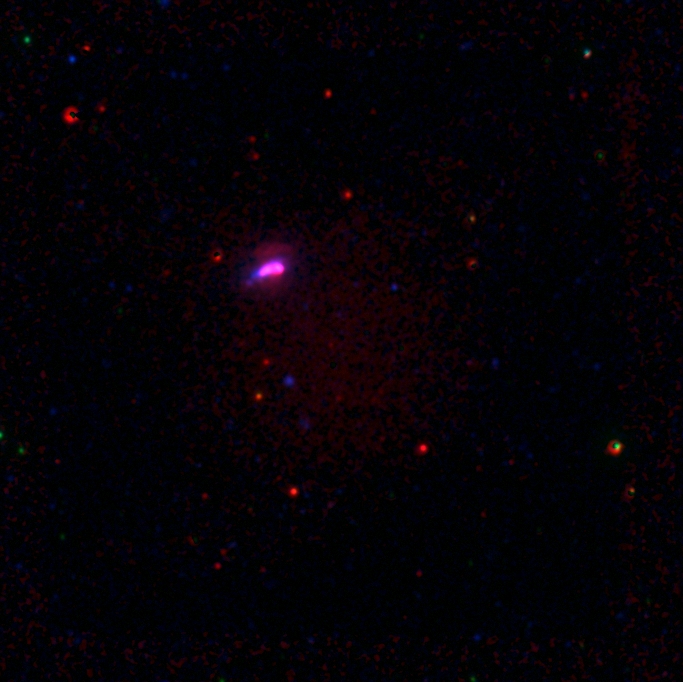
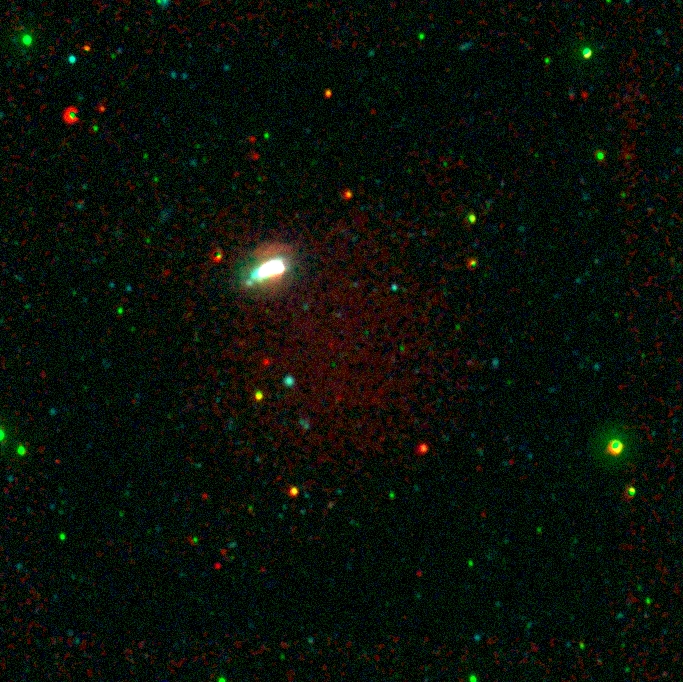
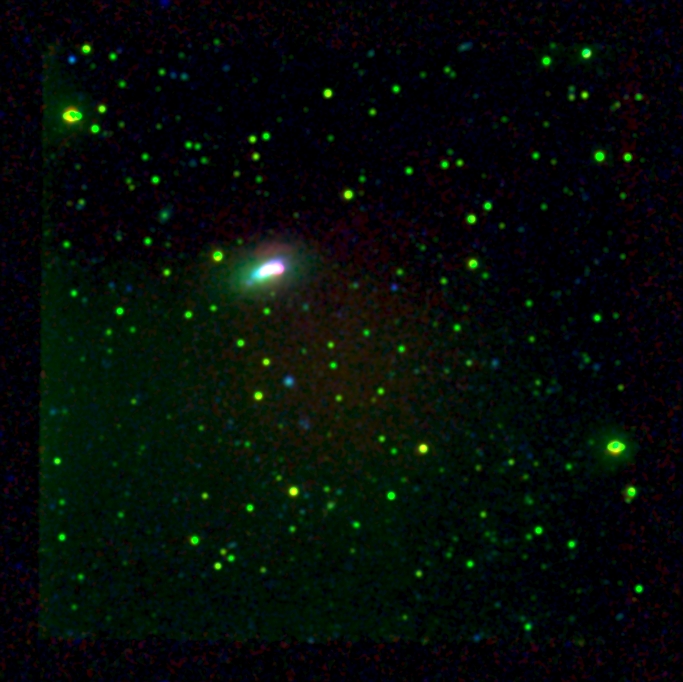
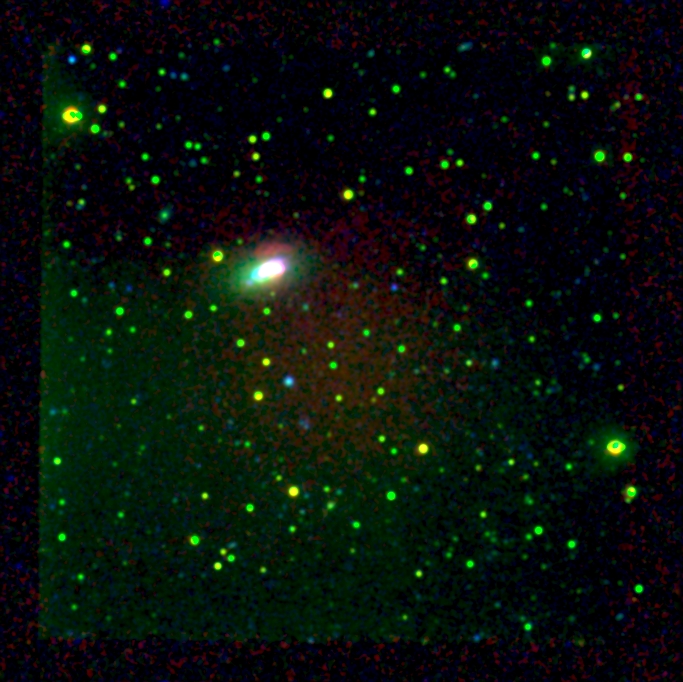
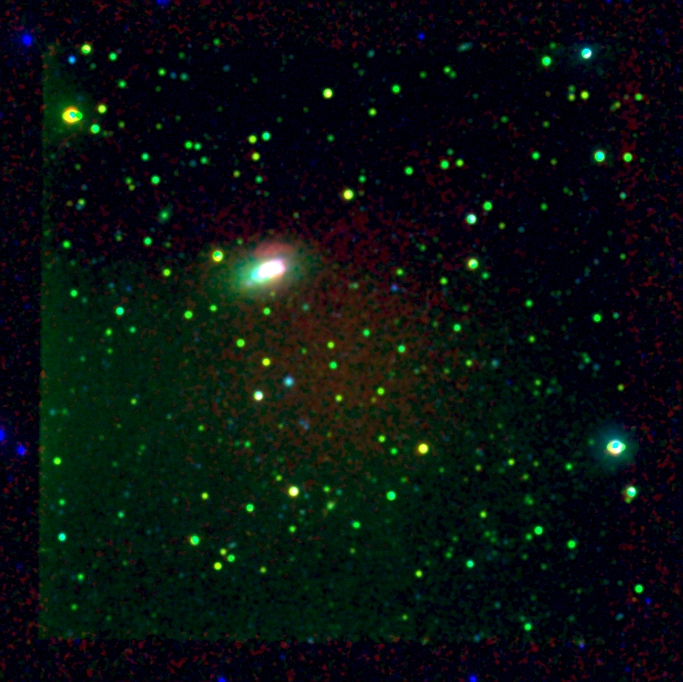
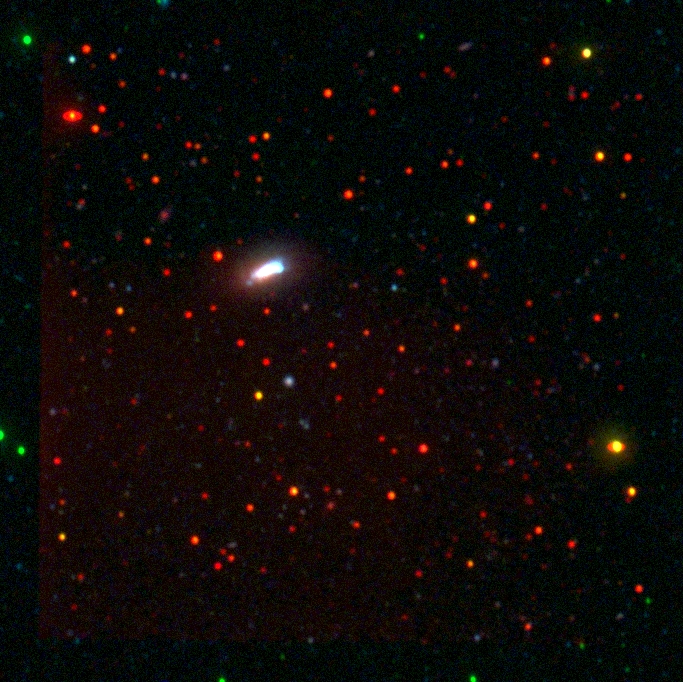
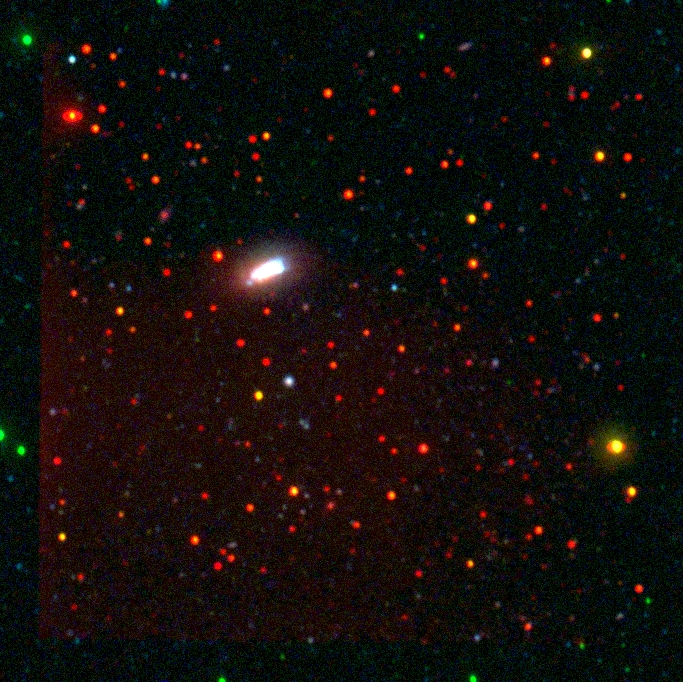
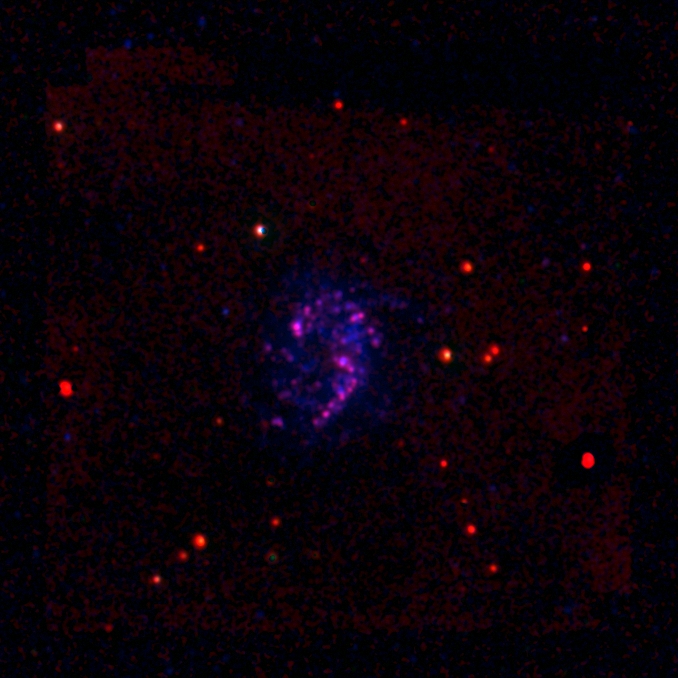
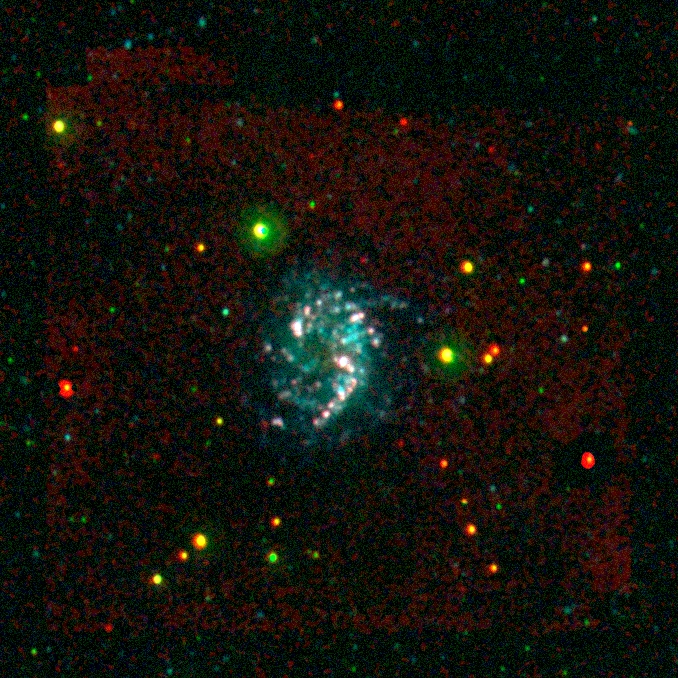
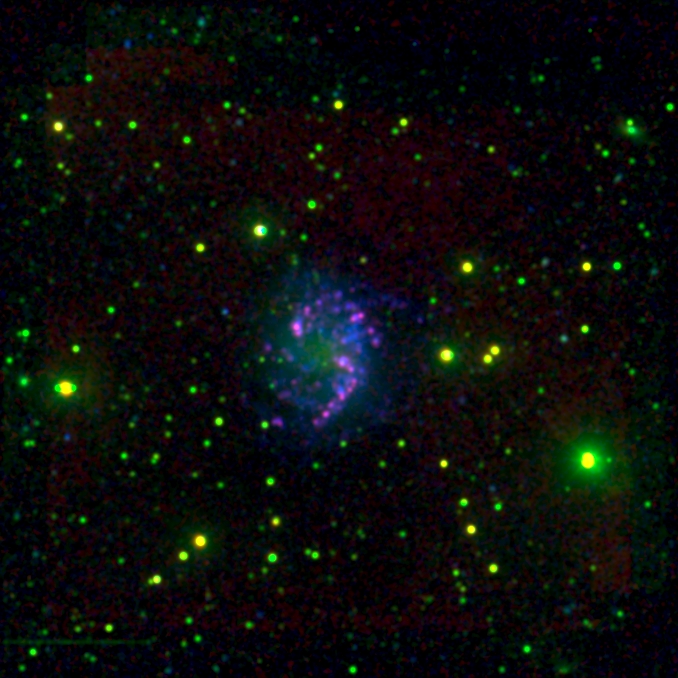
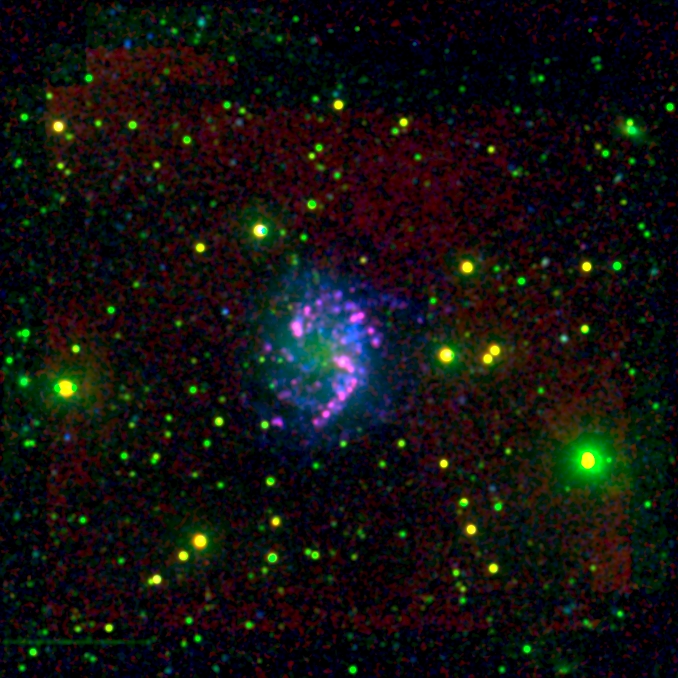
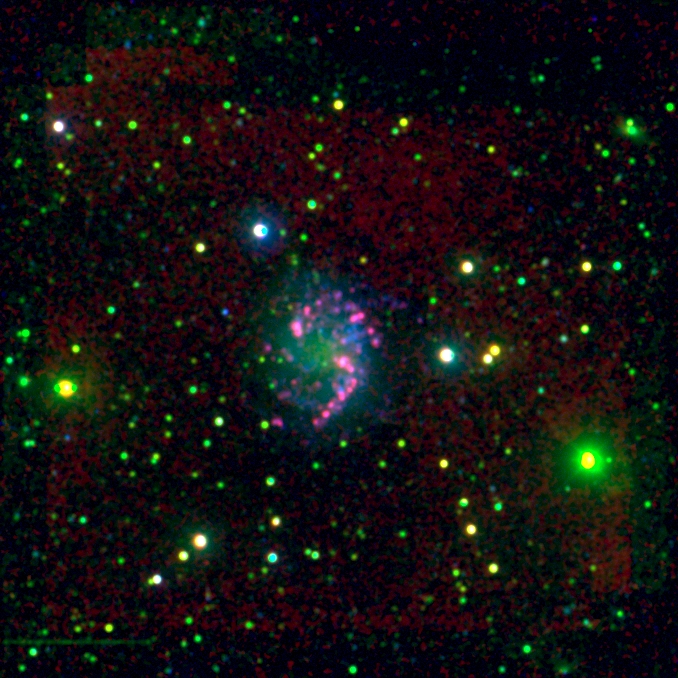
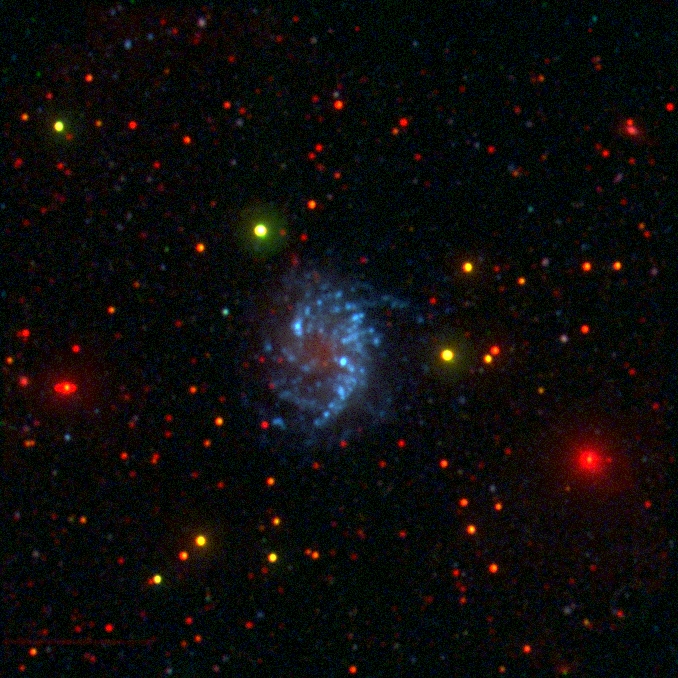
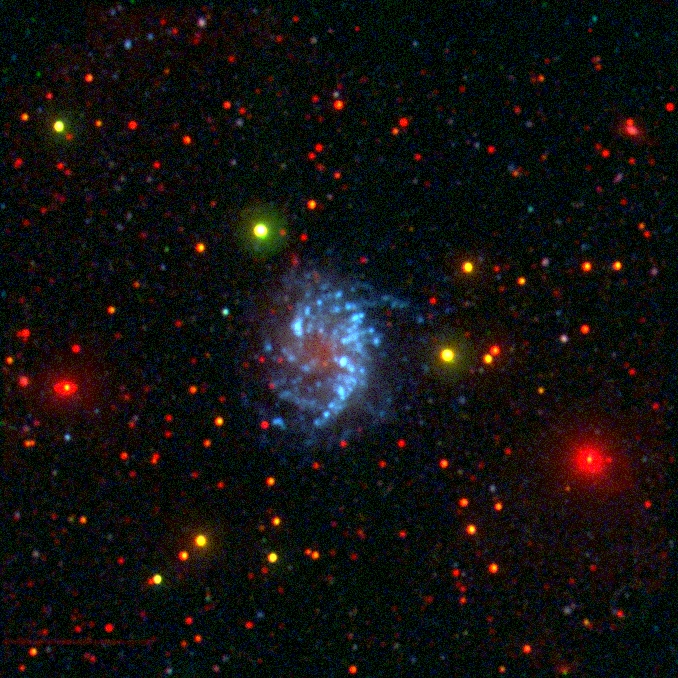
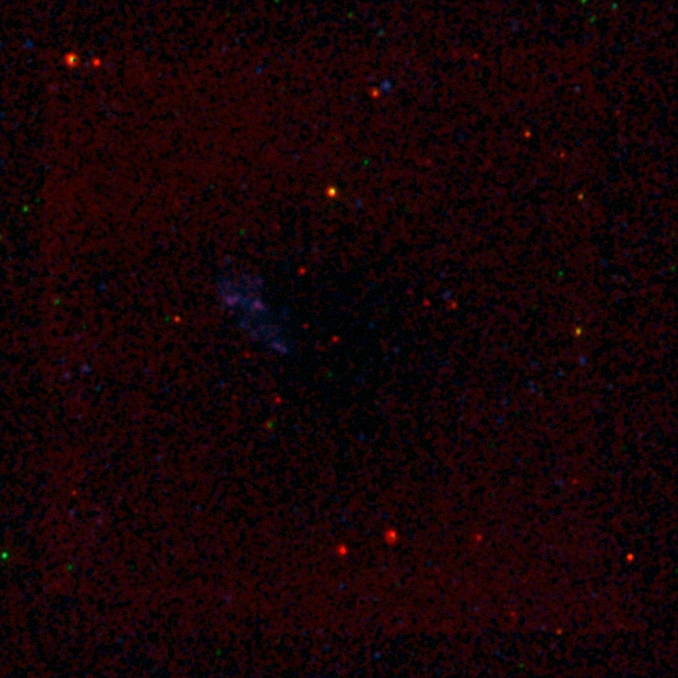
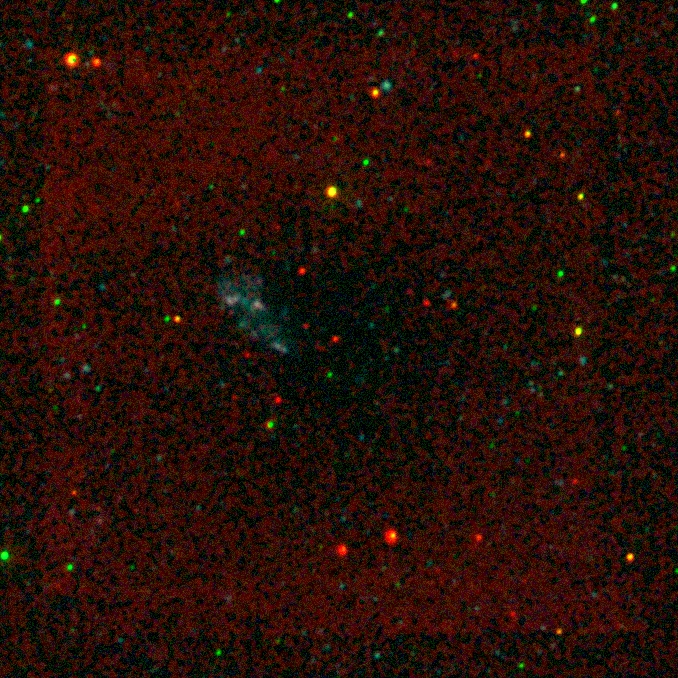
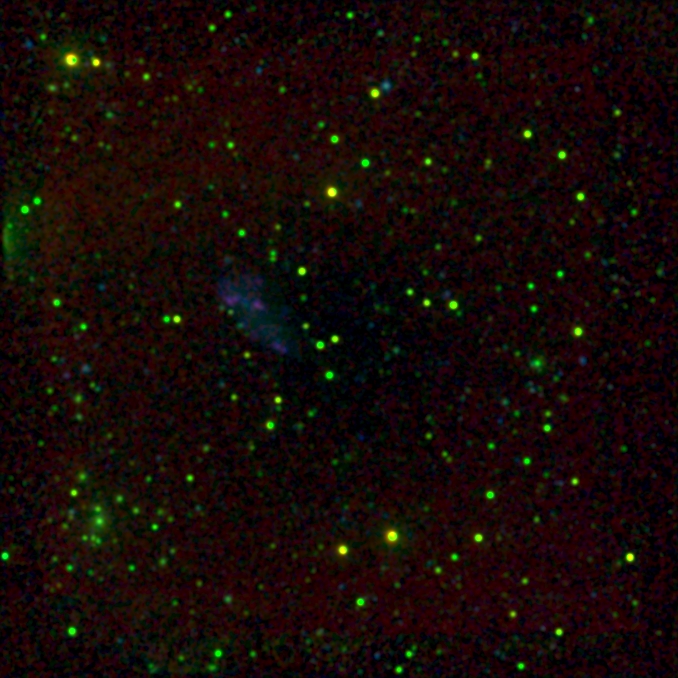
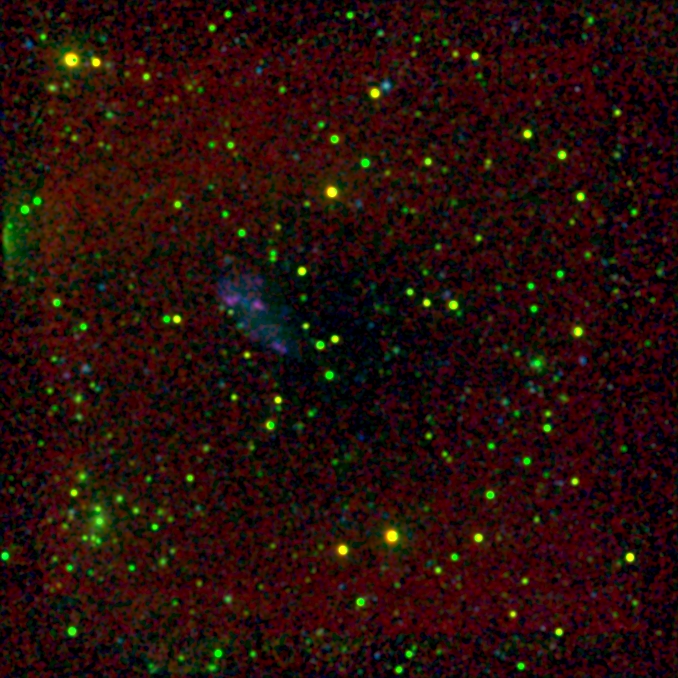
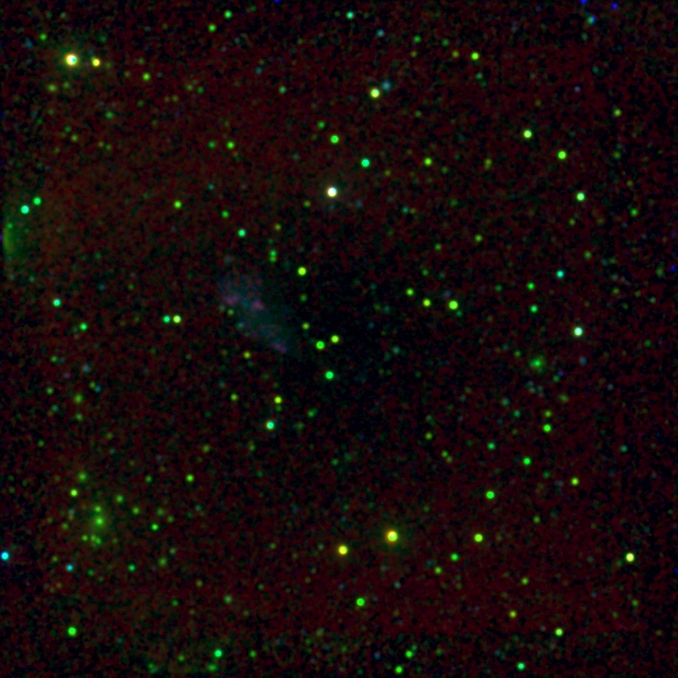
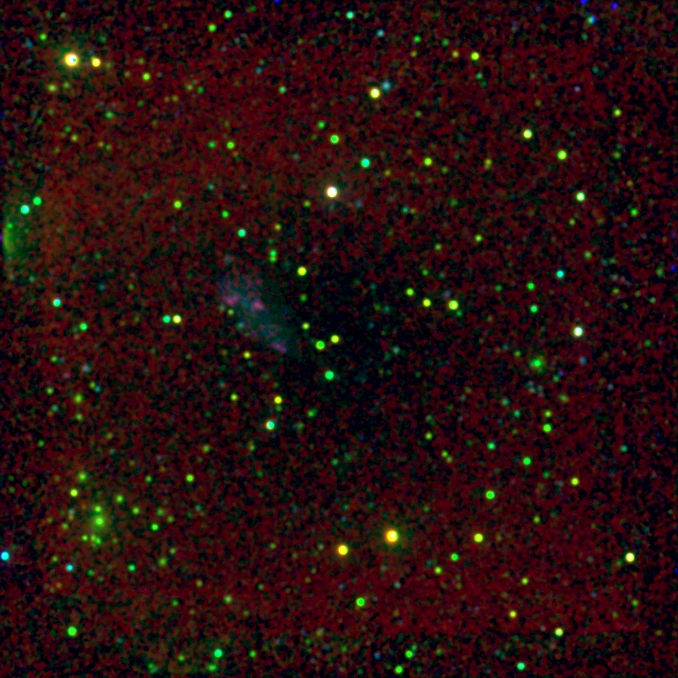
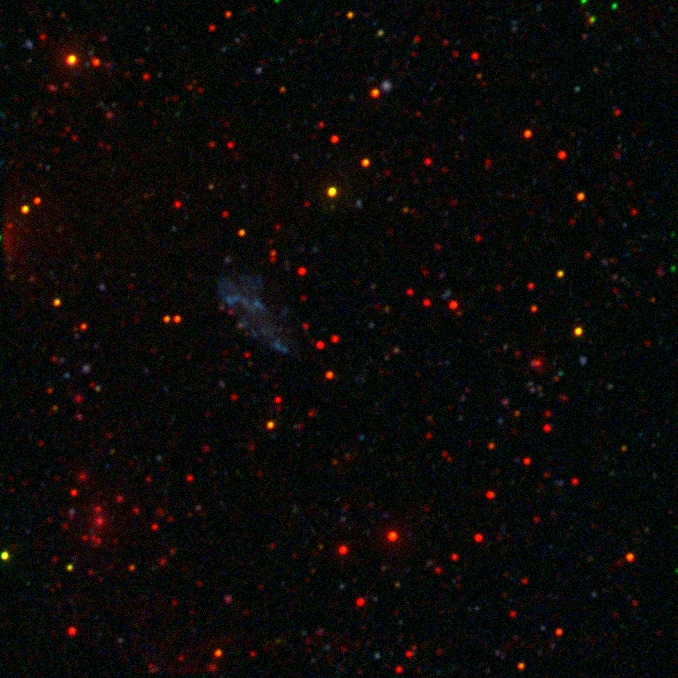
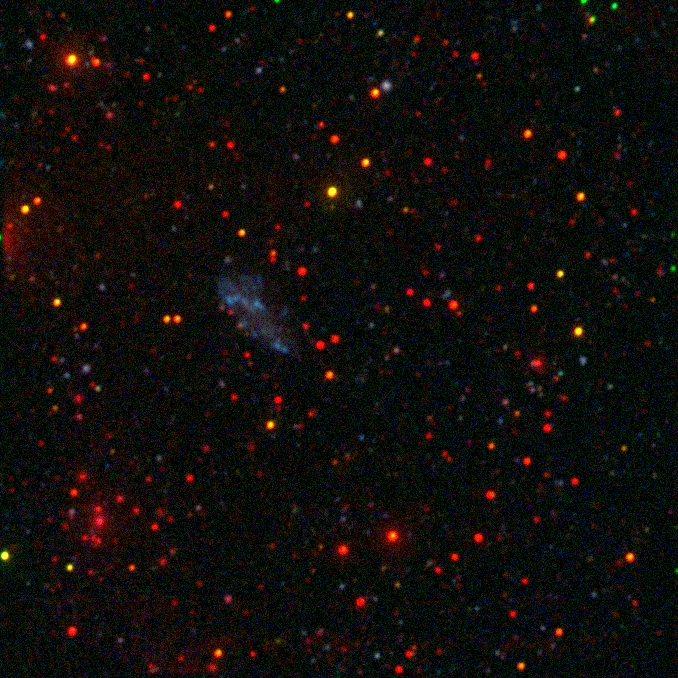
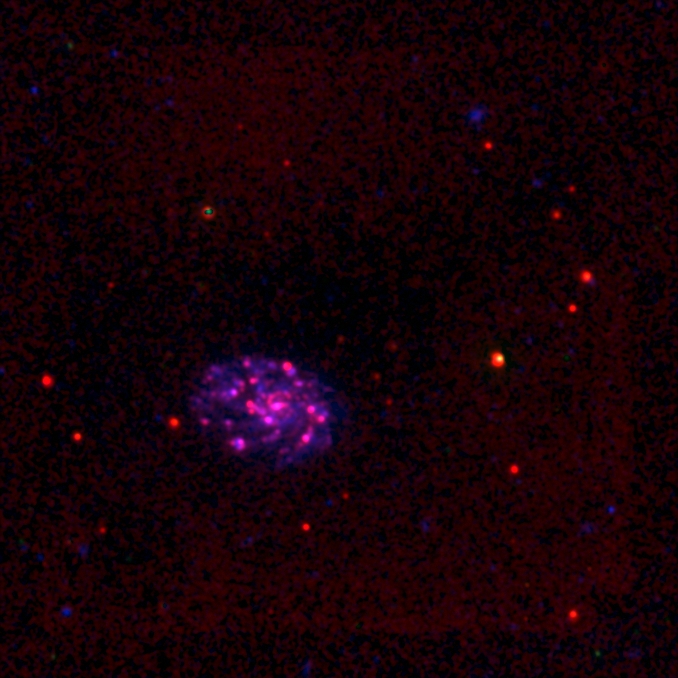
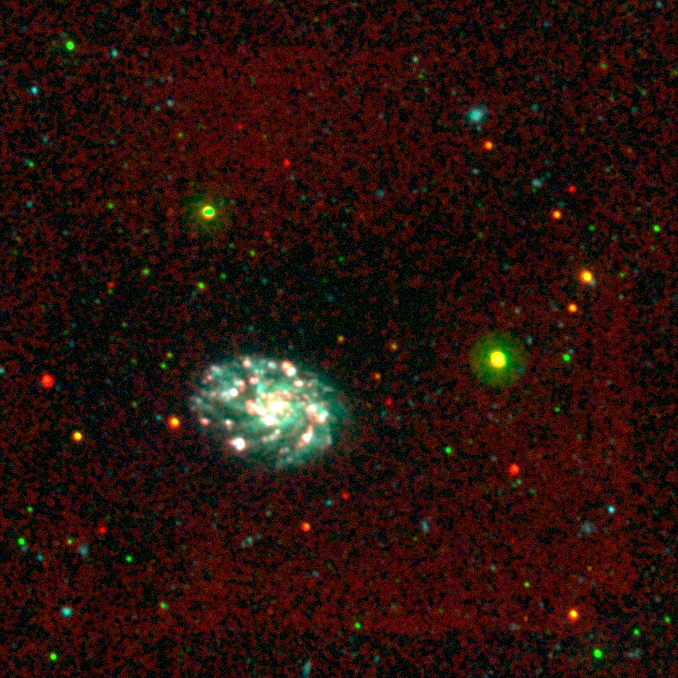
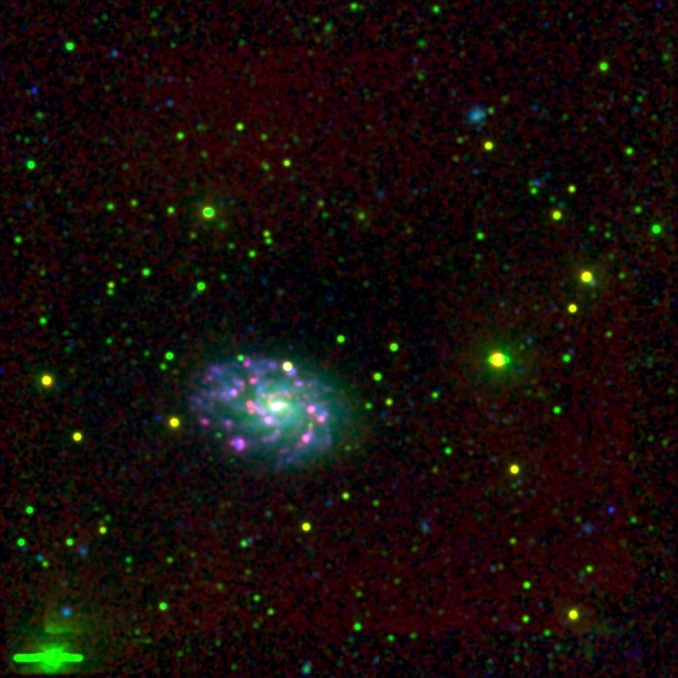
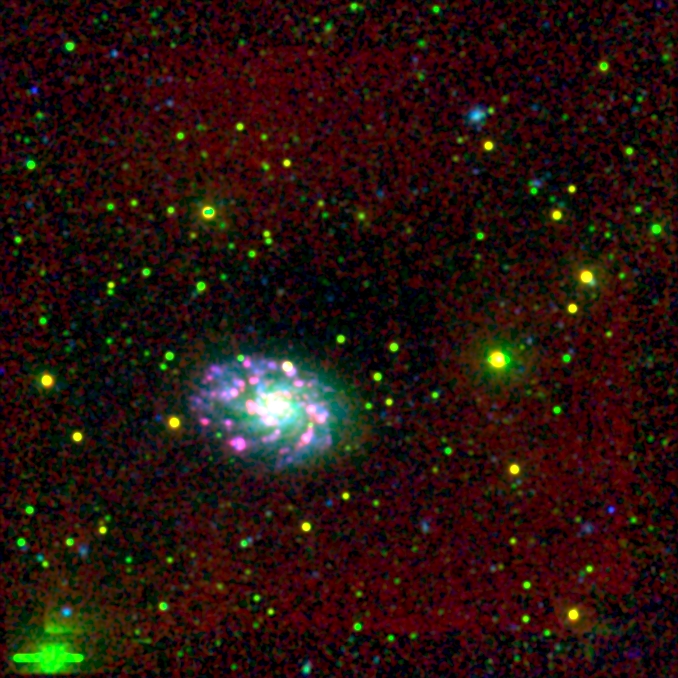
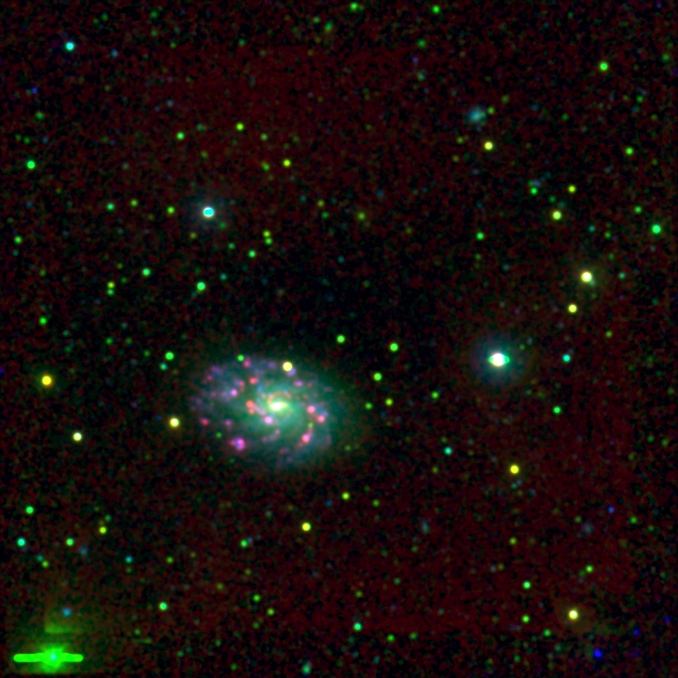
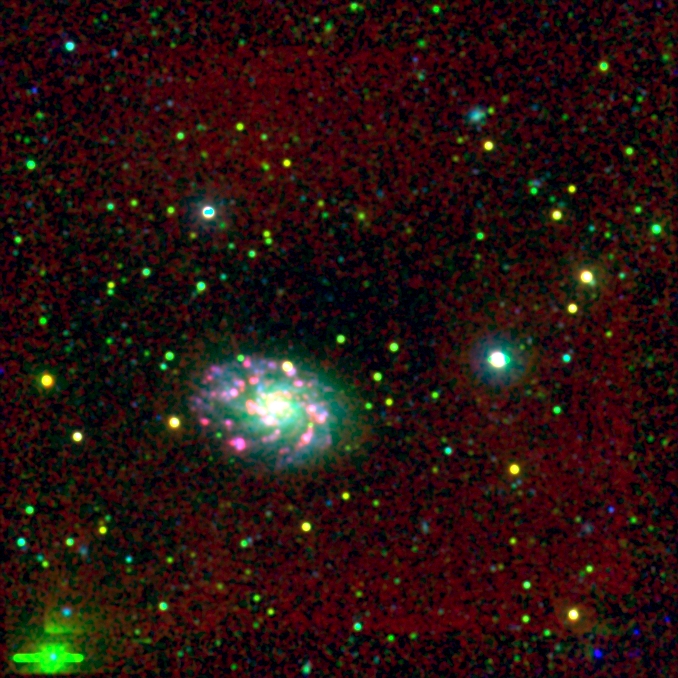
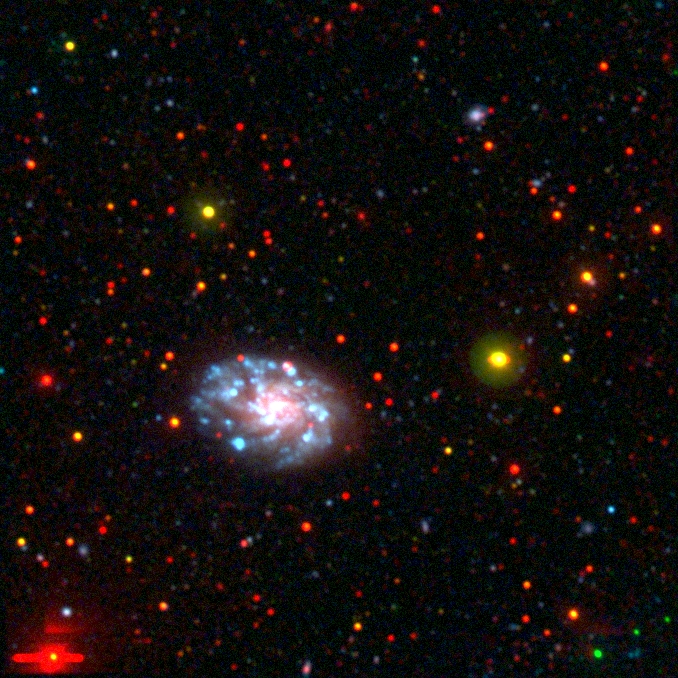
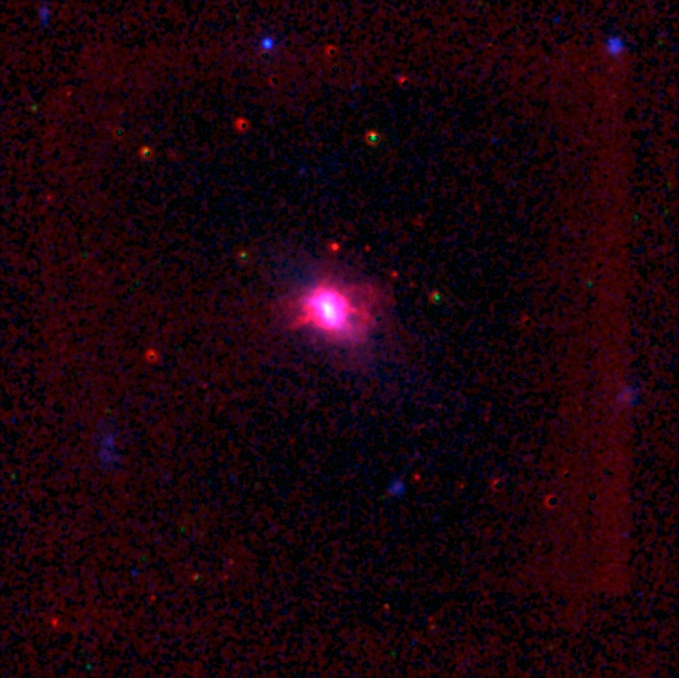
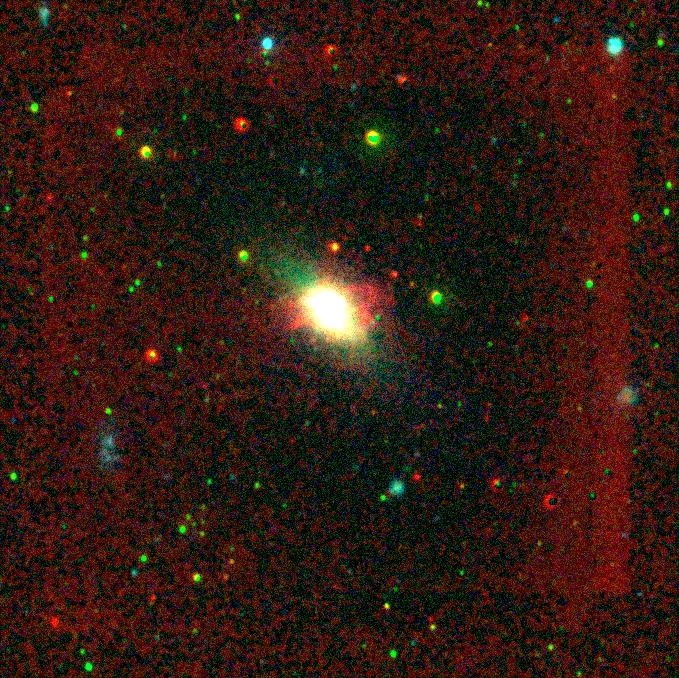
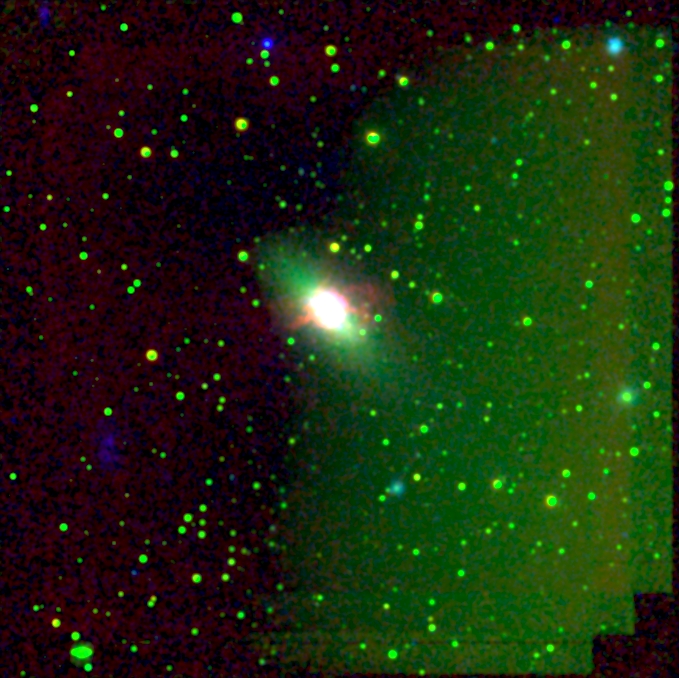
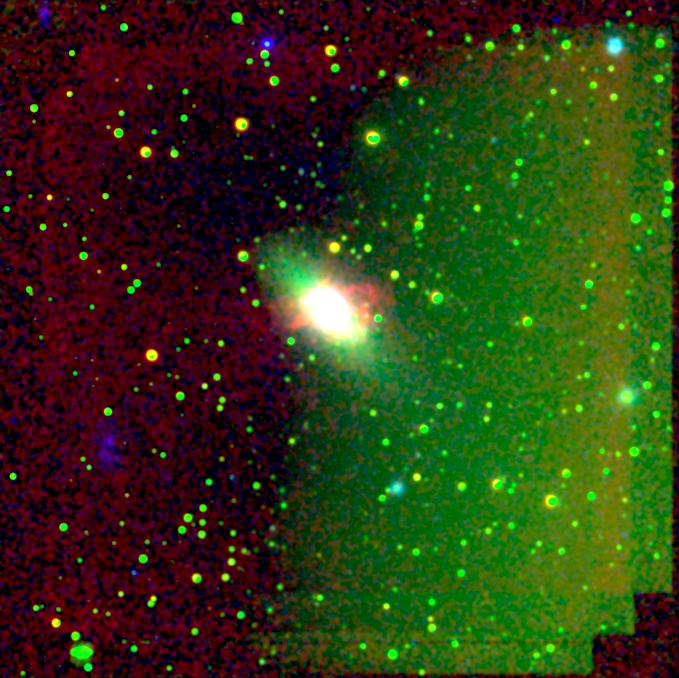
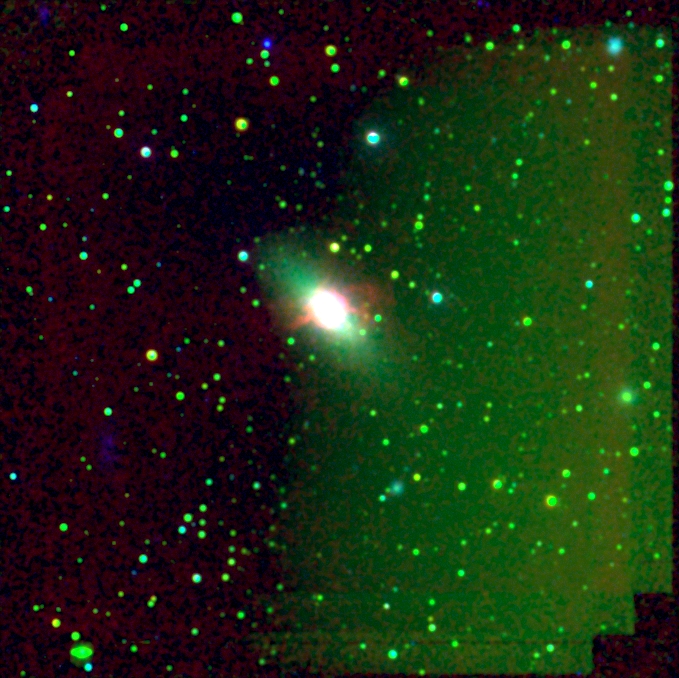
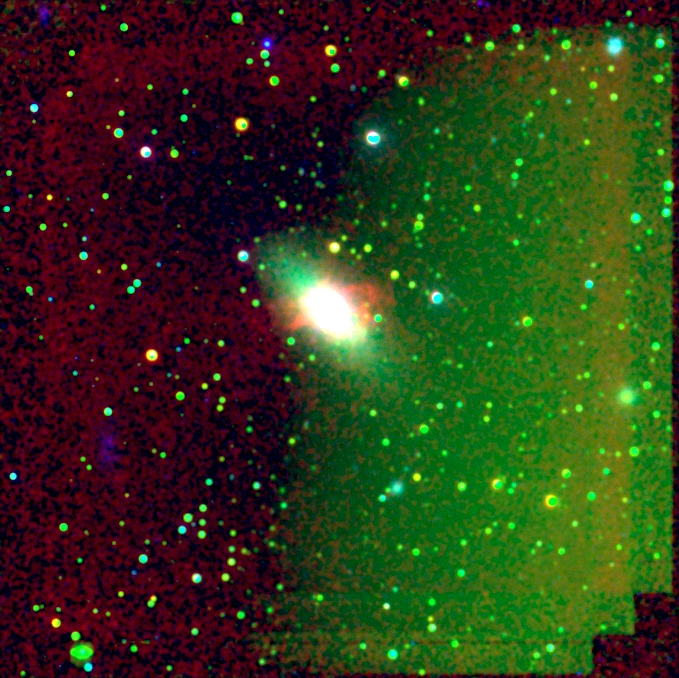
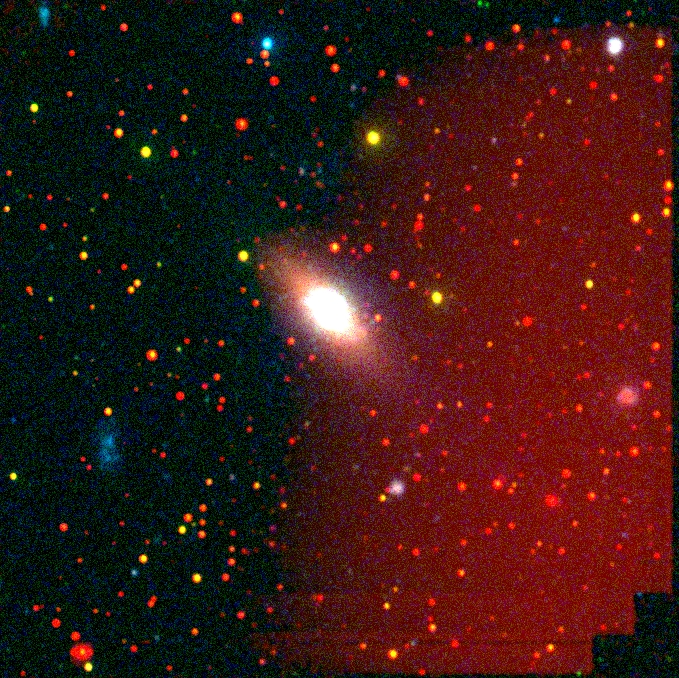
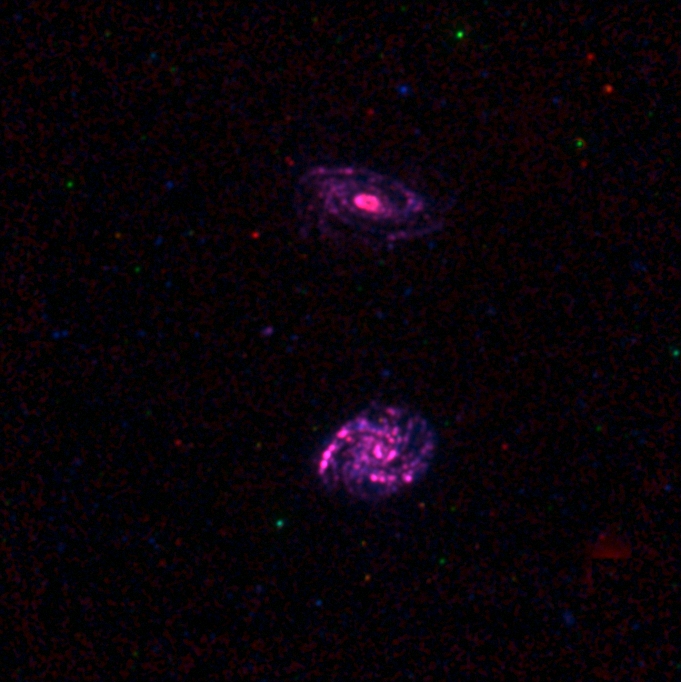
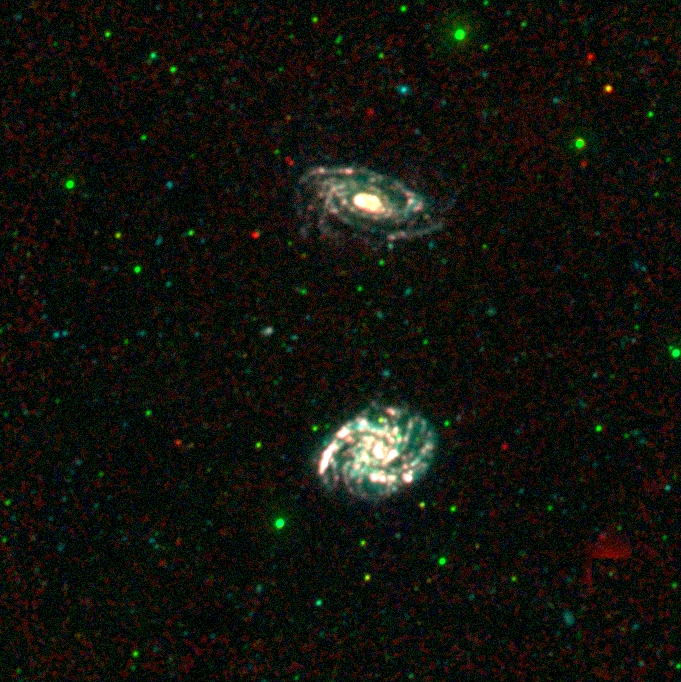
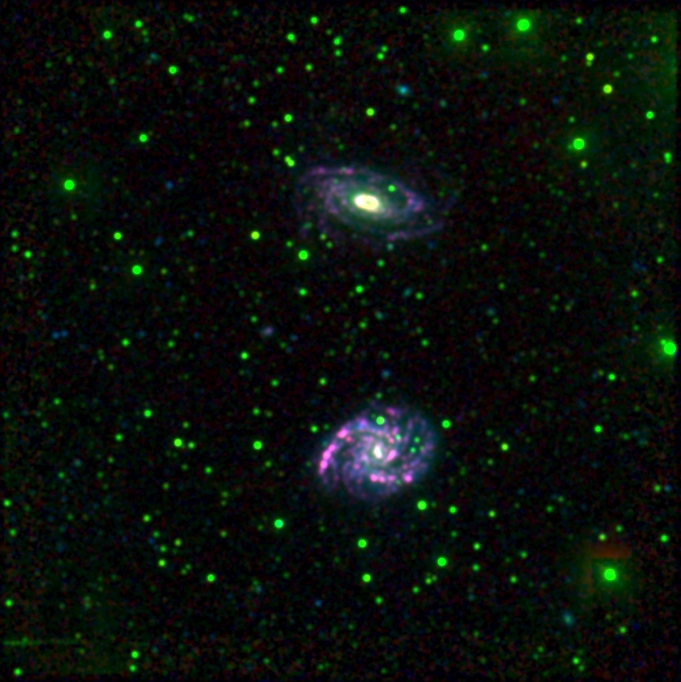
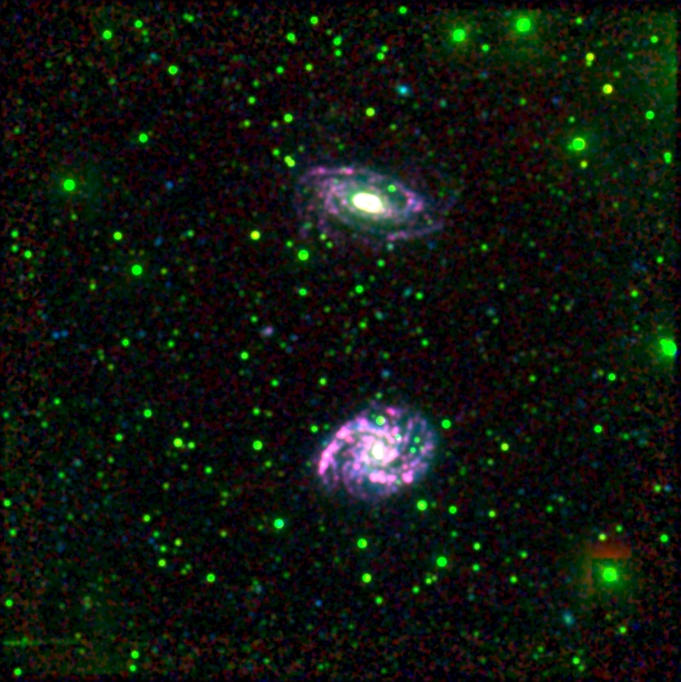
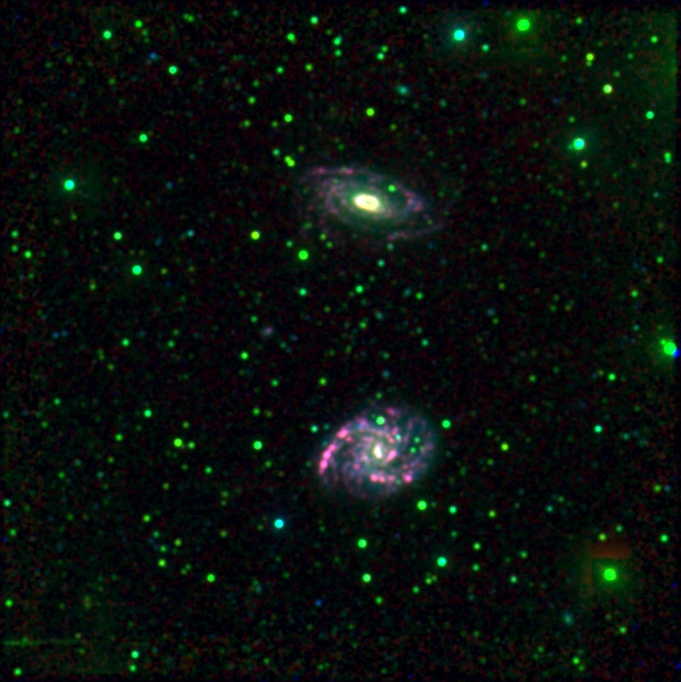
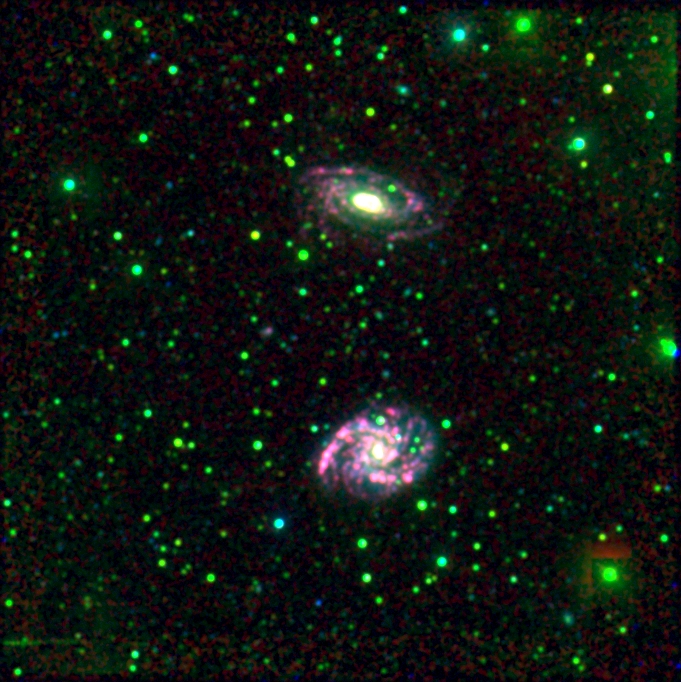
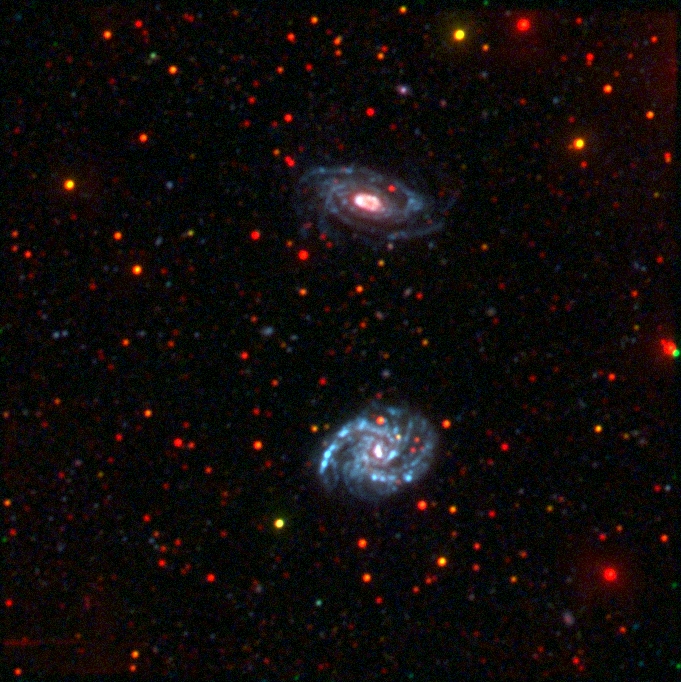
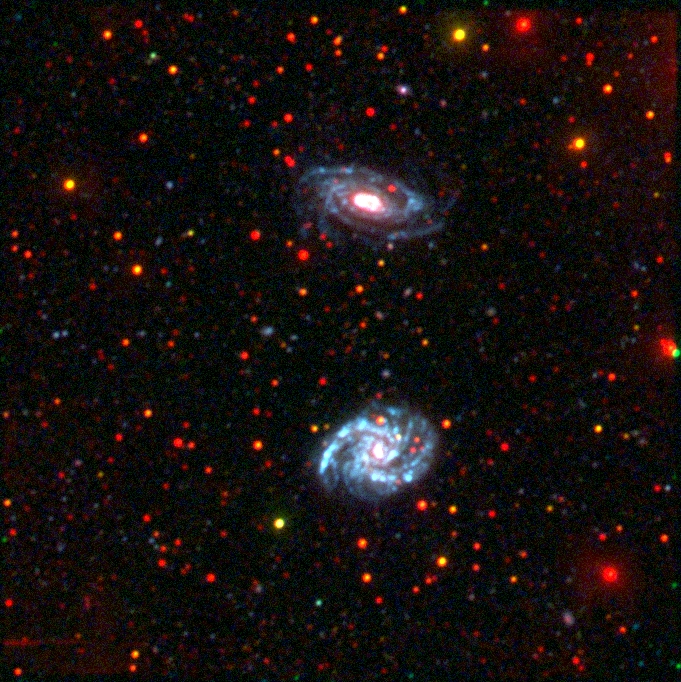
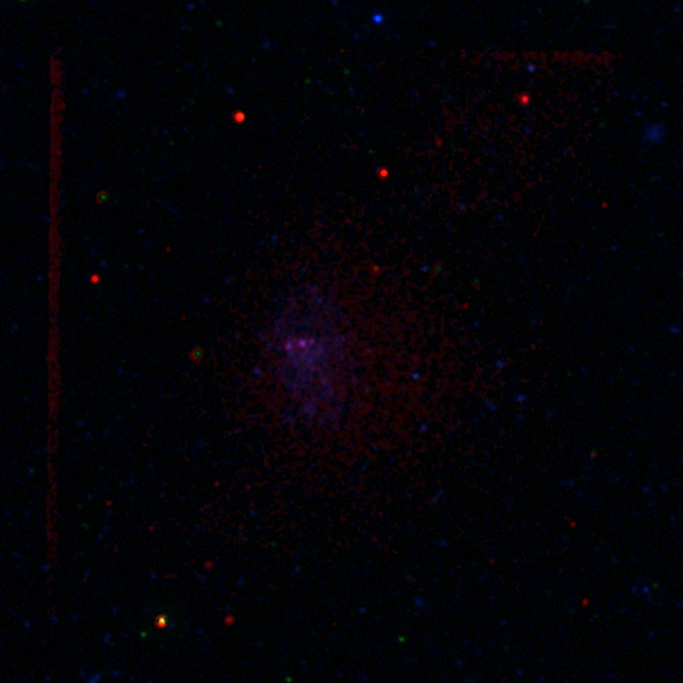
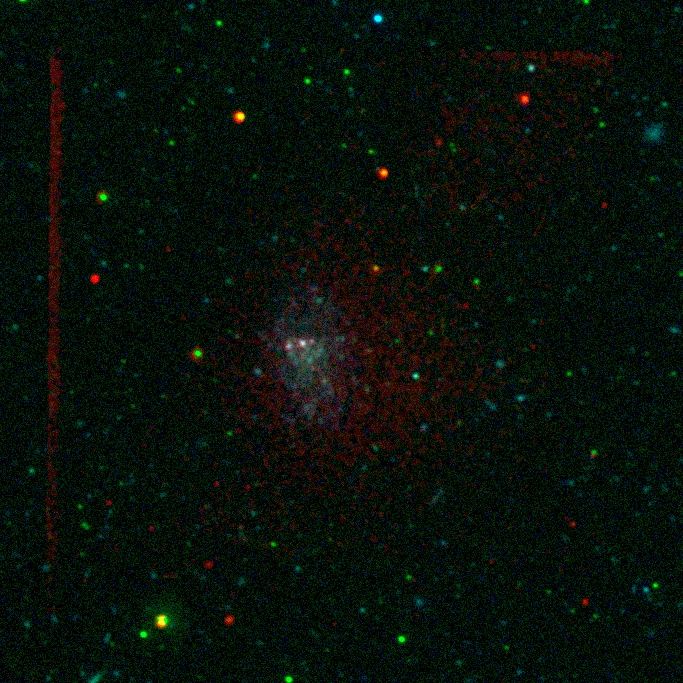
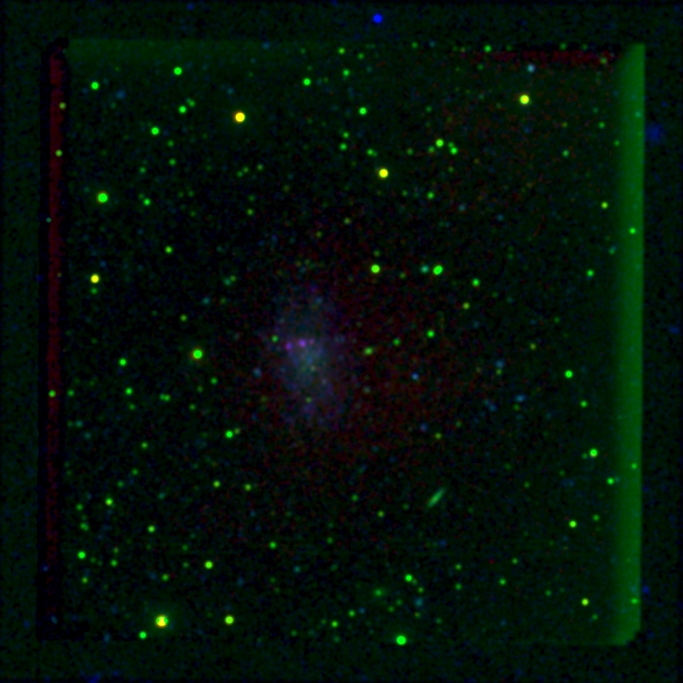
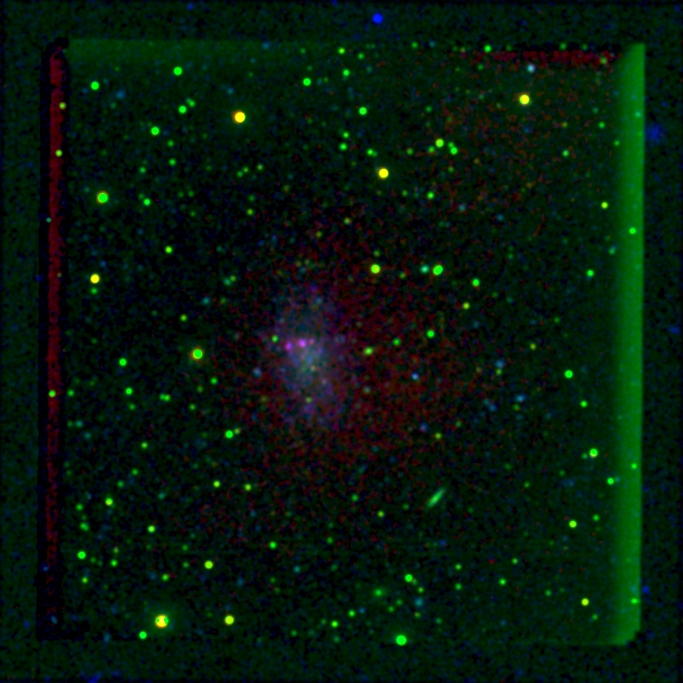
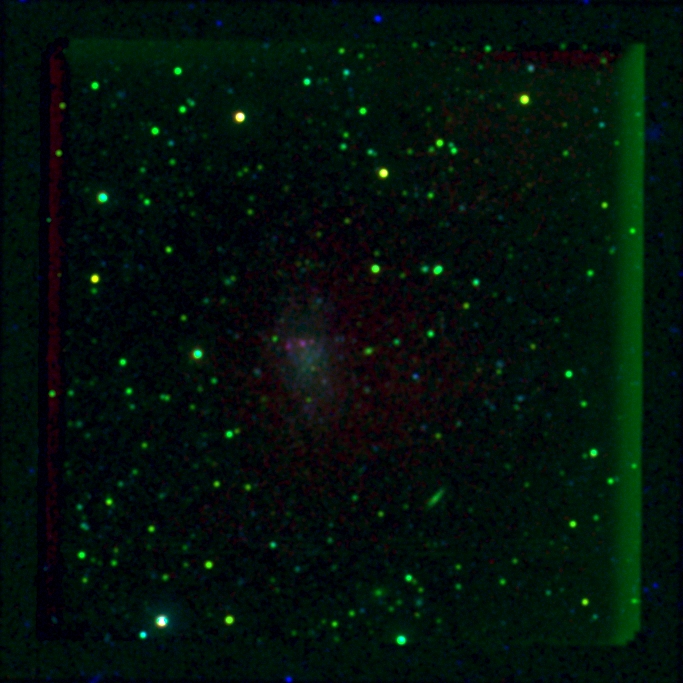
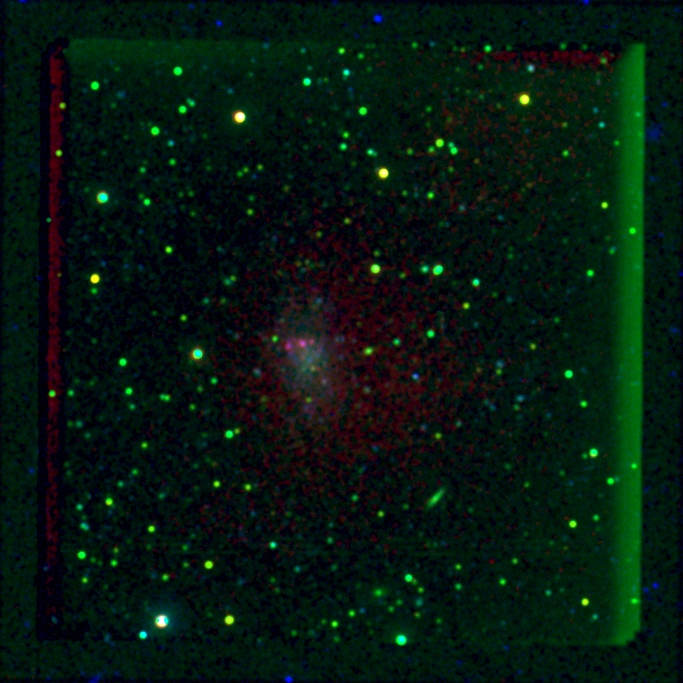
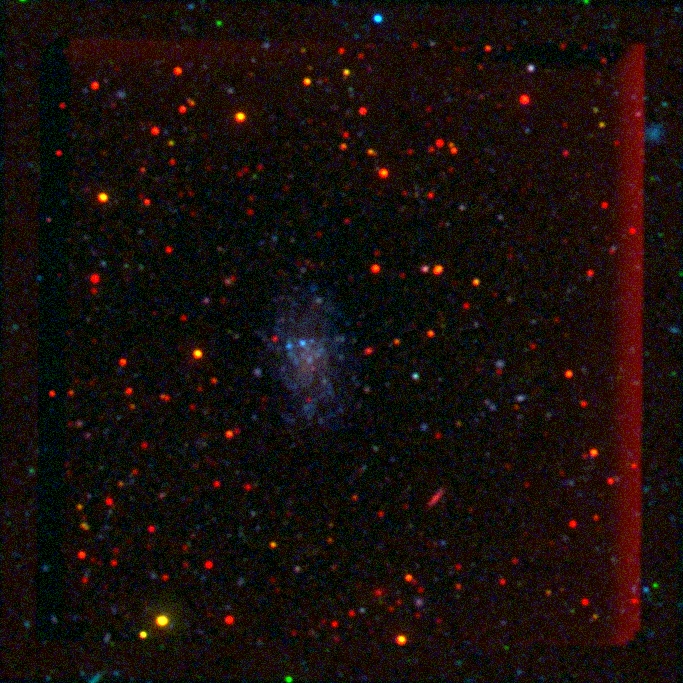
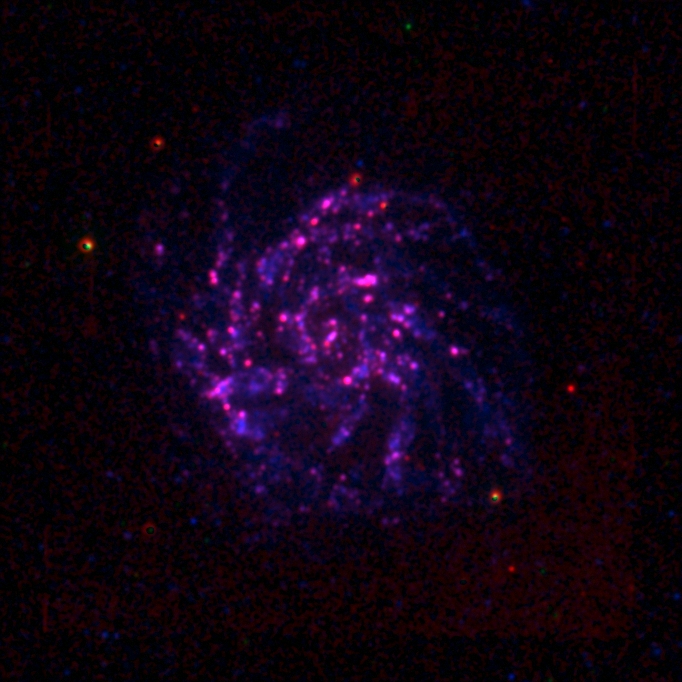
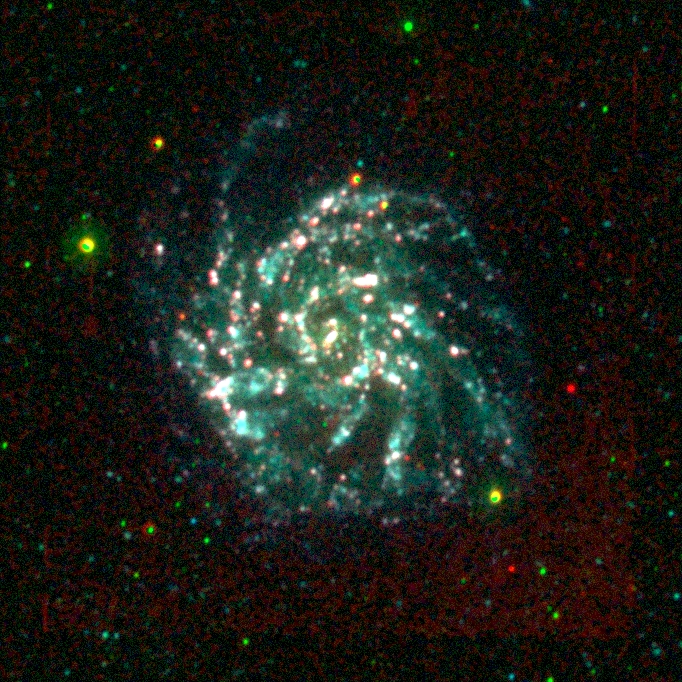
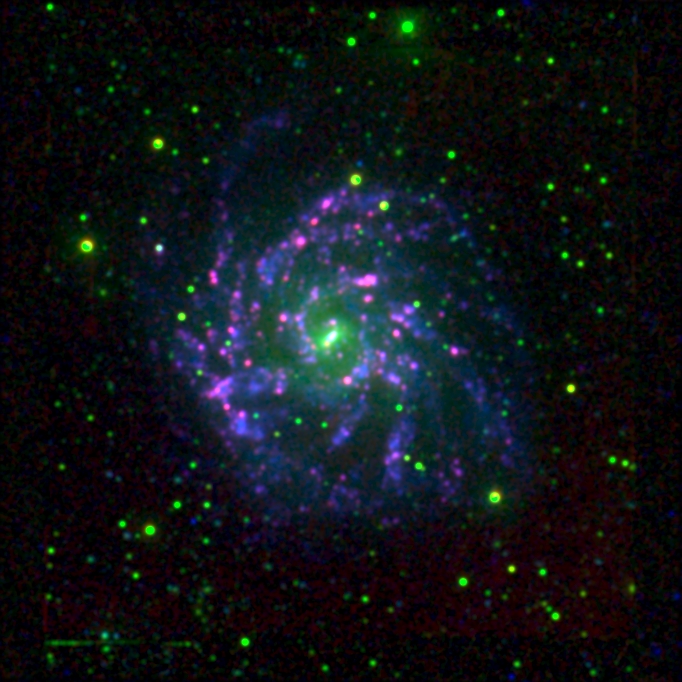
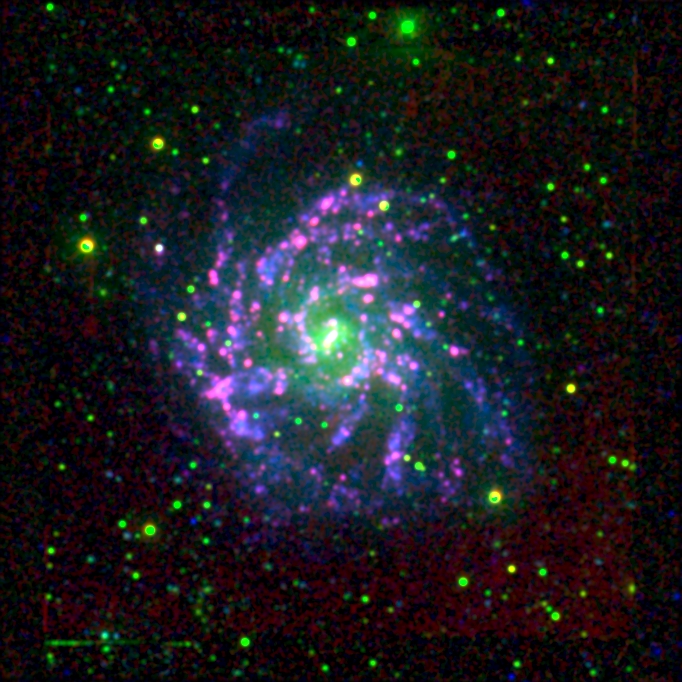
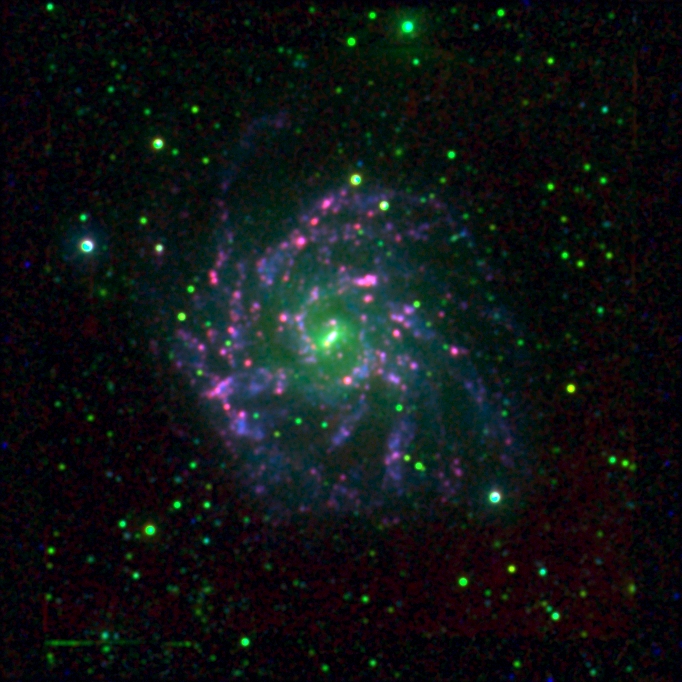
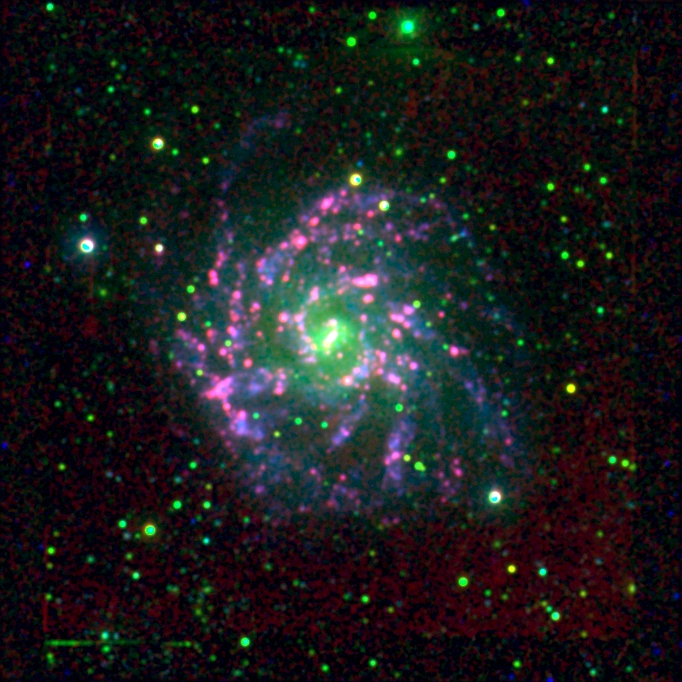
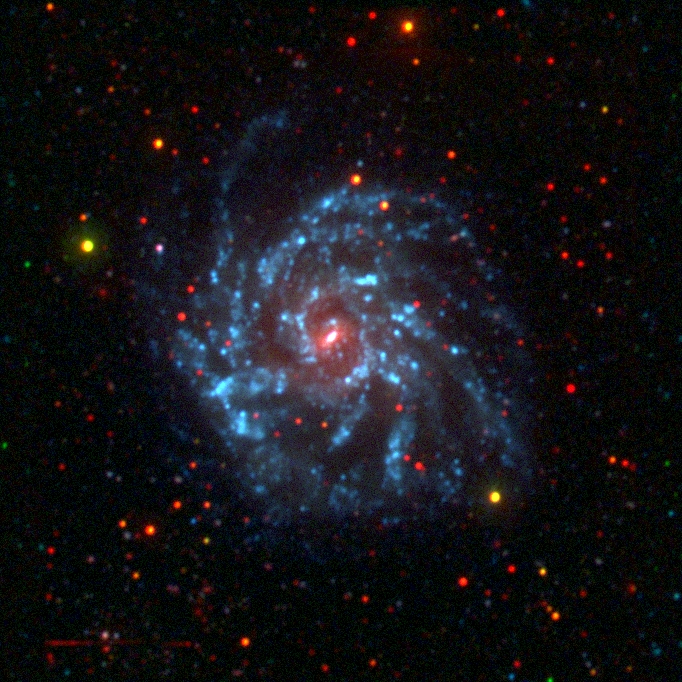
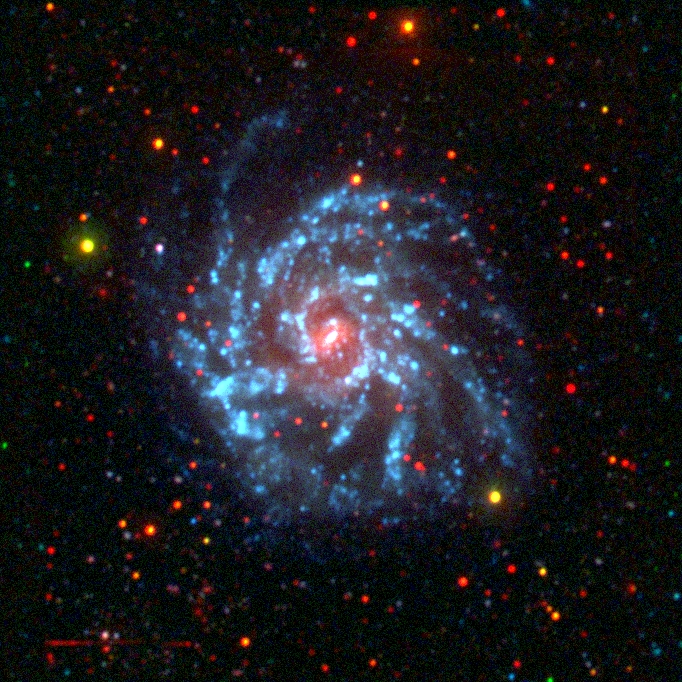
The following table gives the three color images of SINGG-SUNGG sources.
They are matched, aligned and convolved to match the worst
resolution observed which is from the NUV images. This is 5.6" across the sample.
The header rows at the top and bottom of the table give guides to the
four three color combinations in columns 3-6.
Each color - red, green, and blue - indicates
its band. There are two images per each three color combination;
high cut and low cut. High cut images have higher maximum flux values for bands than
low cut images. Fits files, available through
the links in the last column (7), are first compressed with gzip, then archived by tar. Simply run
tar -xvf command to extract them.

This site last updated March 2011
Disclaimer: This page, its contents and style, are the responsibility of the author and do not necessarily represent the views, policies or opinions of the International Centre for Radio Astronomy Research or The University of Western Australia.
Maintainer: Ed Elson (ed.elson -at- icrar.org) and
Gerhardt Meurer (gerhardt.meurer -at- icrar.org).
This site is written using XHTML 1.0 guidelines, and uses CSS. To view this page properly, get the latest version browser for your computer.